User Manual
Guide to using the Onco-eQTM Explorer
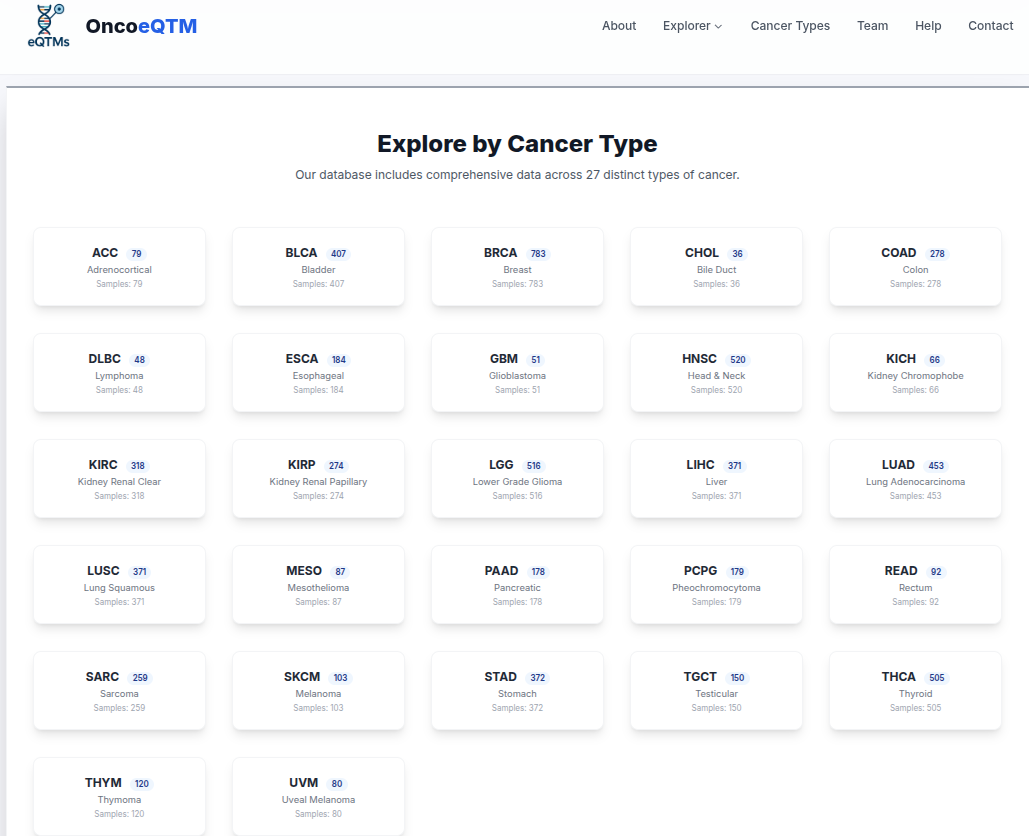
1. Home Page
The home page provides access to all analysis modules and displays available cancer types.
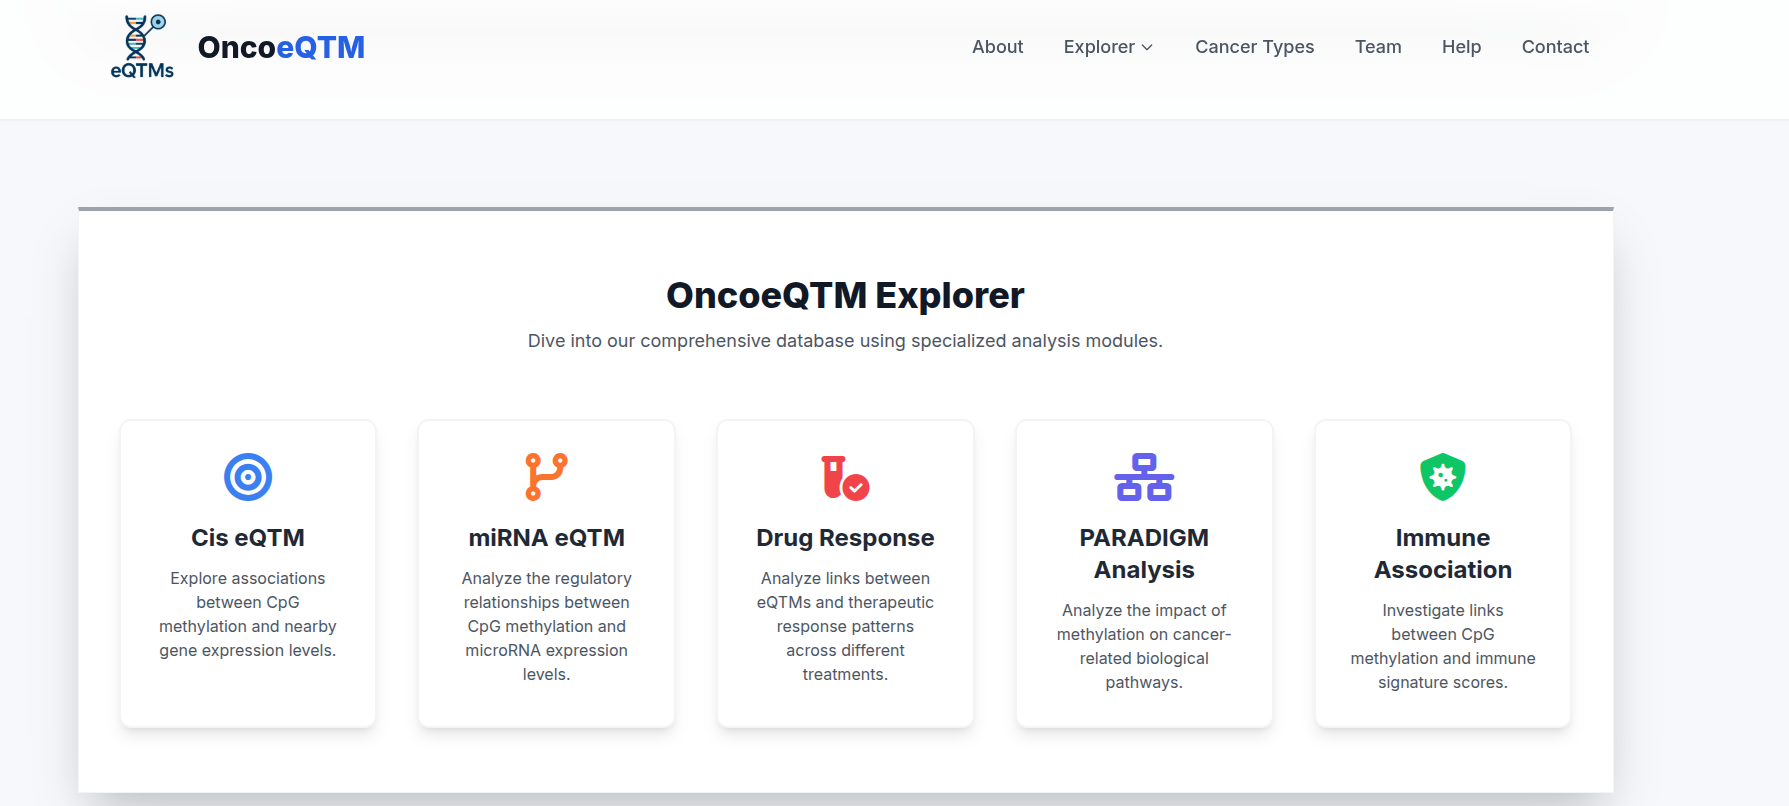
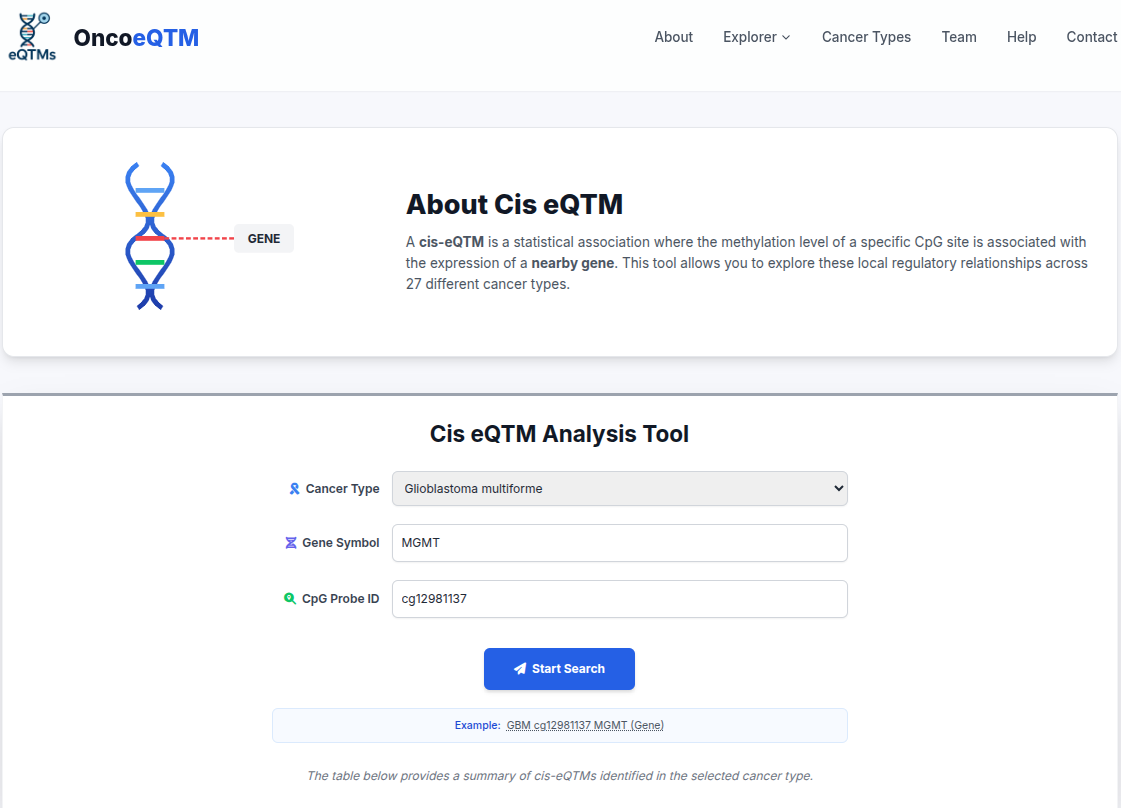
Cis-eQTM Analysis
Identify CpG sites located within 1Mb of a gene's transcription start site (TSS) that significantly correlate with its expression.
Step 1: Search & Filter
Select a cancer type and optionally filter by Gene Symbol, CpG ID, or Cancer Type.
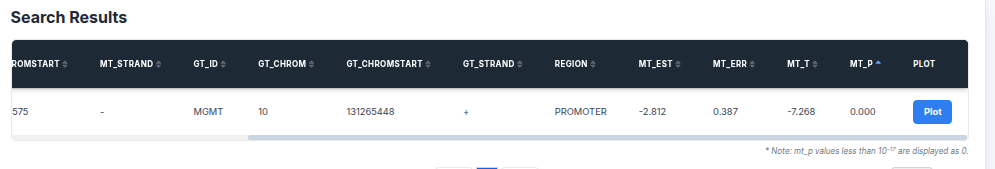
Step 2: View Results
The results table displays significant associations. Click "Plot" to visualize.
Step 3: Interactive Visualization
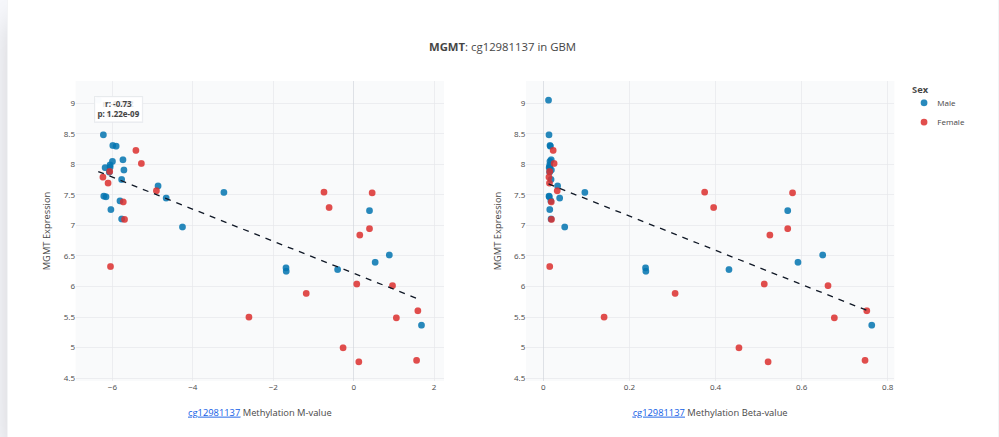
- X-Axis: DNA Methylation (Beta Value)
- Y-Axis: Gene Expression (log2 normalized)
- Correlation: Negative correlation implies methylation silences gene expression.
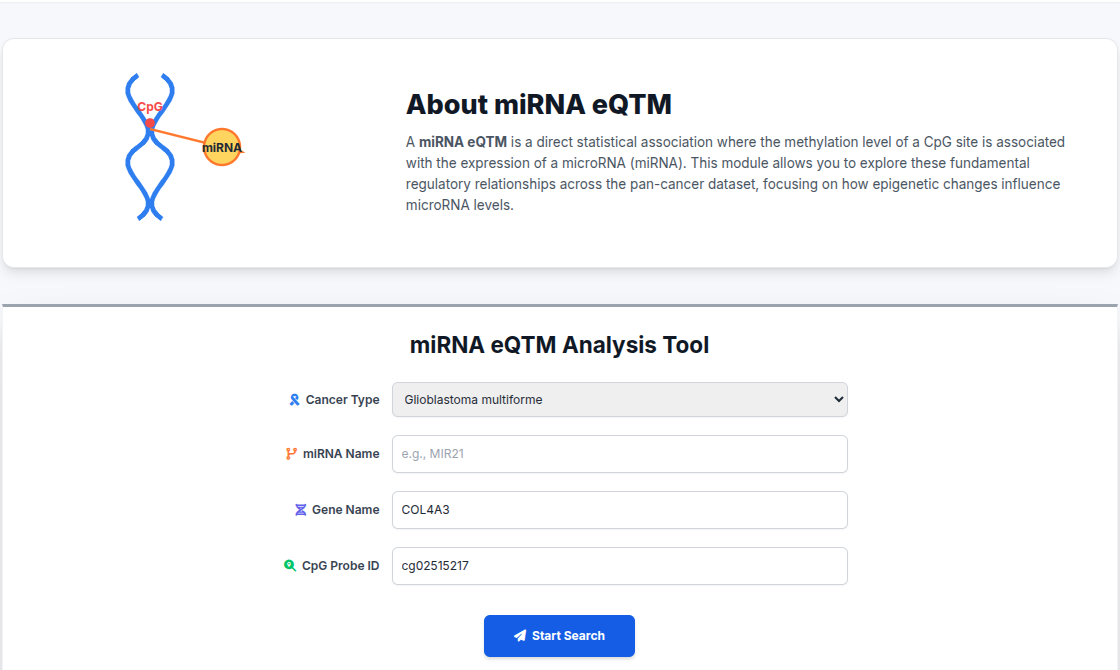
miRNA eQTM Analysis
Explore how methylation at miRNA loci affects the expression of downstream target genes.
Step 1: Search & Filter
Select a cancer type and optionally filter by miRNA Name, Target Gene, or Cancer Type.
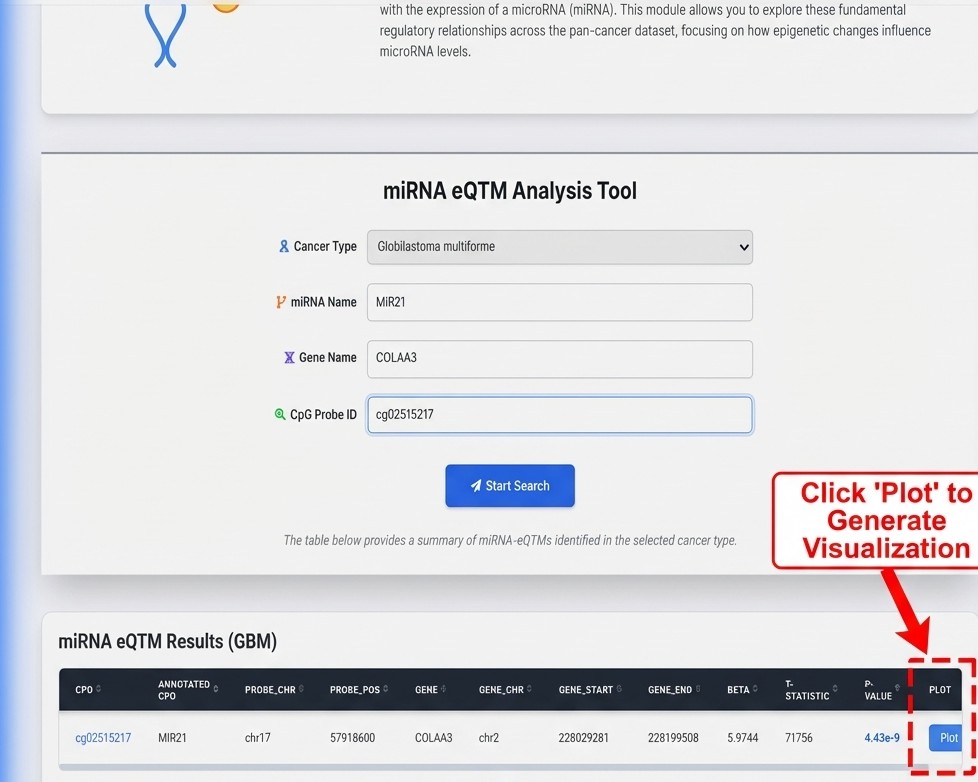
Step 2: View Results
The results table displays significant associations. Click "Plot" to visualize.
Step 3: Interactive Visualization
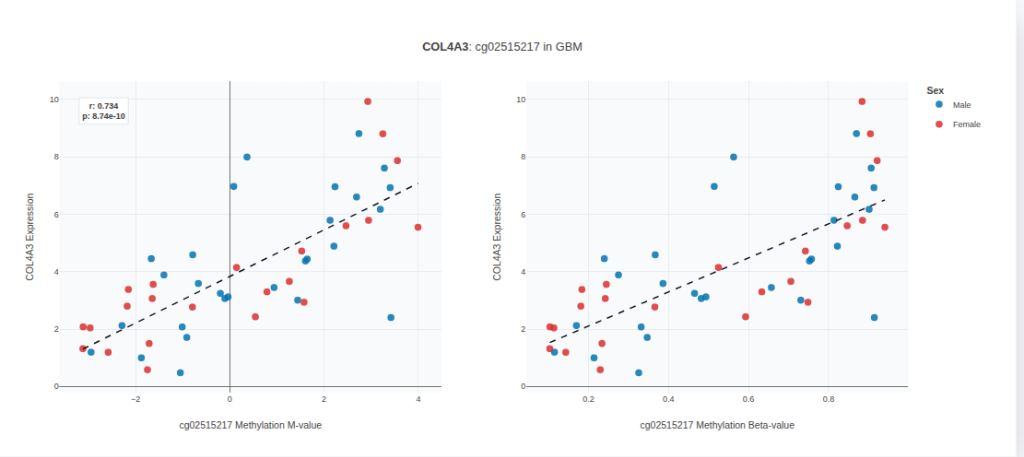
- X-Axis: DNA Methylation (Beta Value)
- Y-Axis: Target Gene Expression
- Correlation: Inverse correlation suggests miRNA-mediated repression is modulated by methylation.
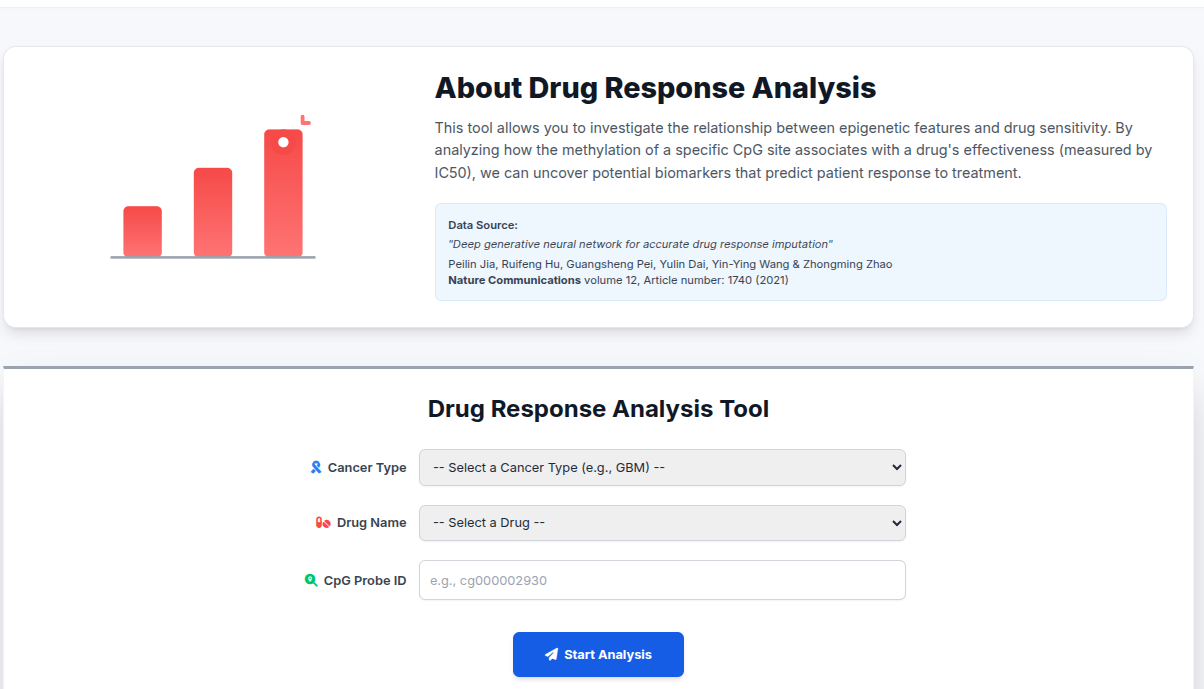
Drug Response Analysis
Explore associations between DNA methylation and imputed drug sensitivity (IC50) scores.
Step 1: Search & Filter
Select a cancer type and optionally filter by Drug Name or Gene Symbol.
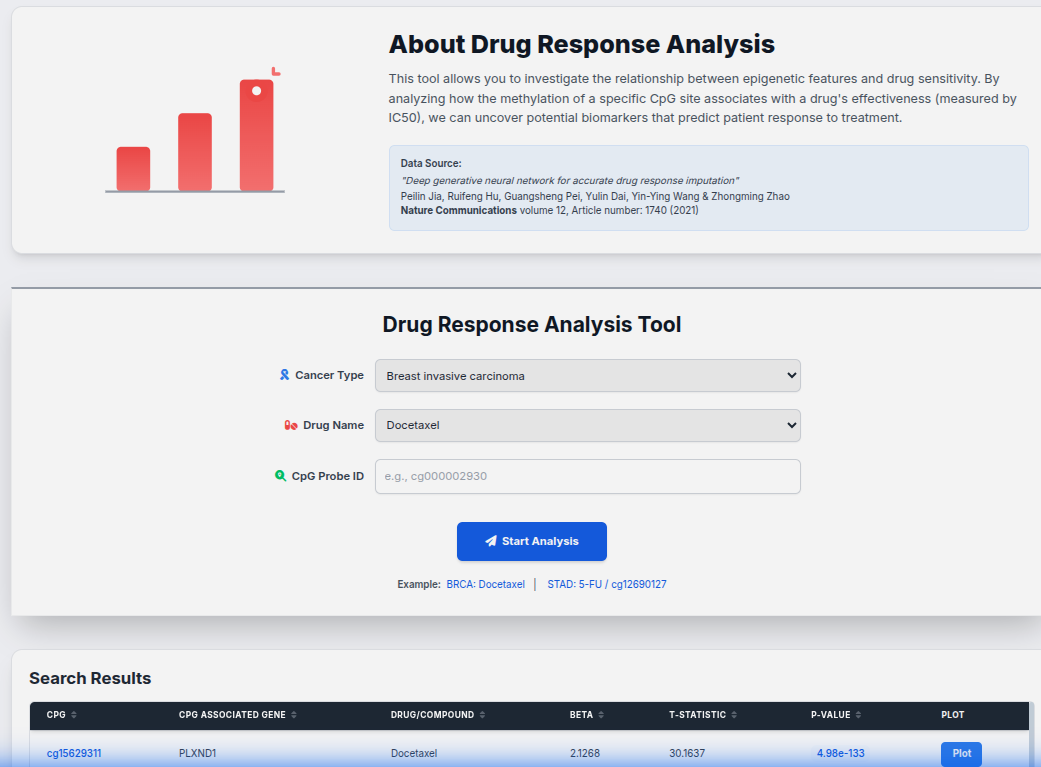
Step 2: View Results
The results table displays significant associations. Click "Plot" to visualize.
Step 3: Interactive Visualization
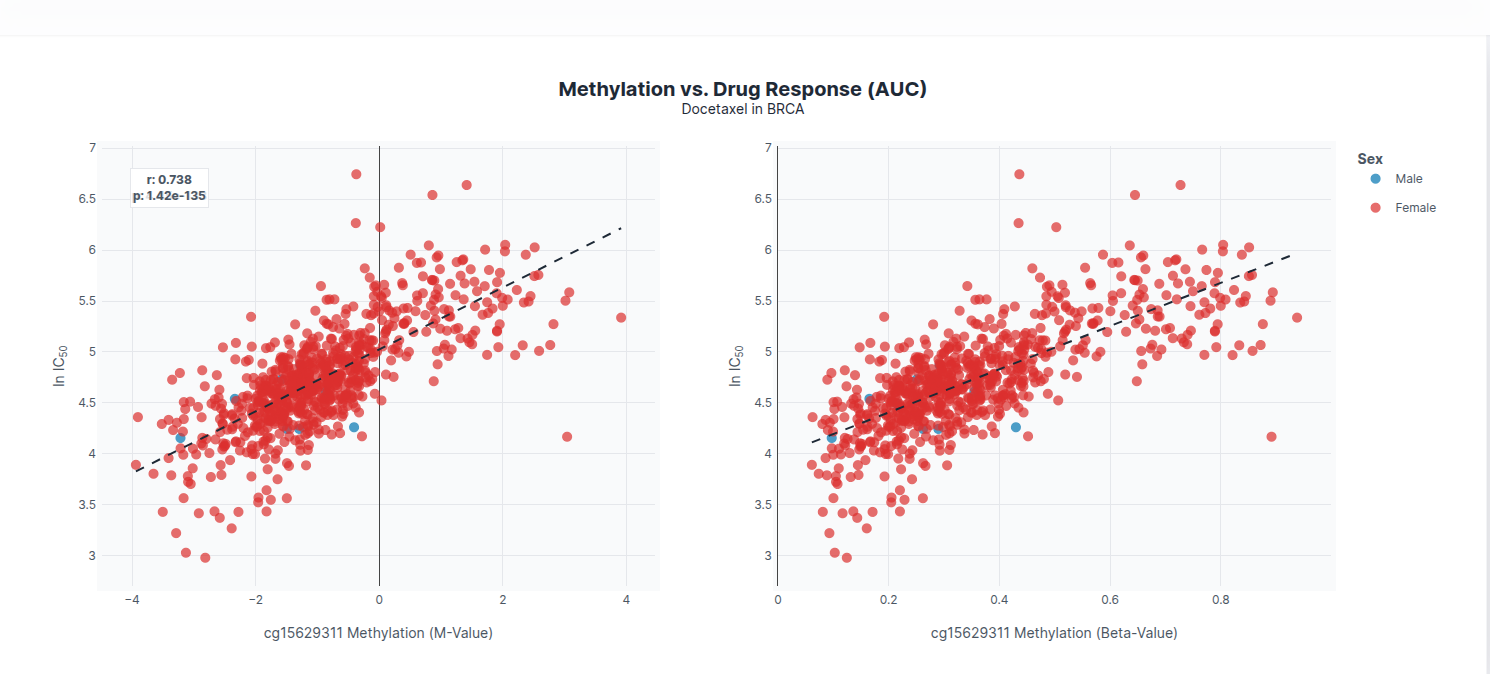
- X-Axis: DNA Methylation (Beta Value) and M-Value (Log-converted)
- Y-Axis: Drug IC50 Score (Predicted Sensitivity)
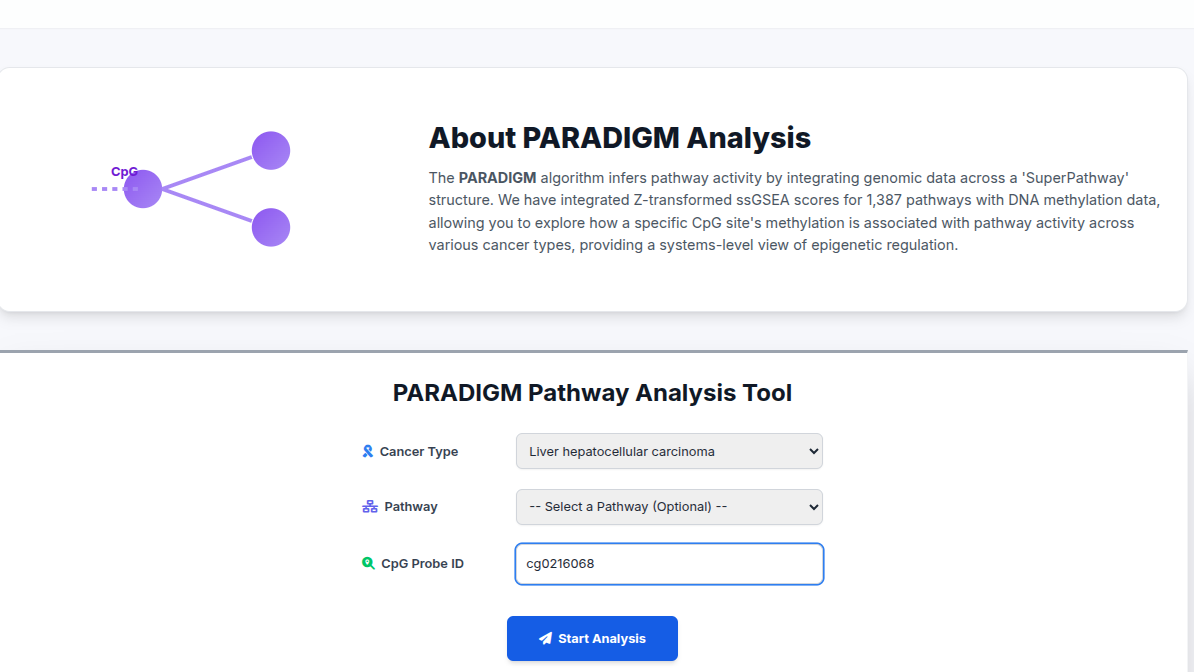
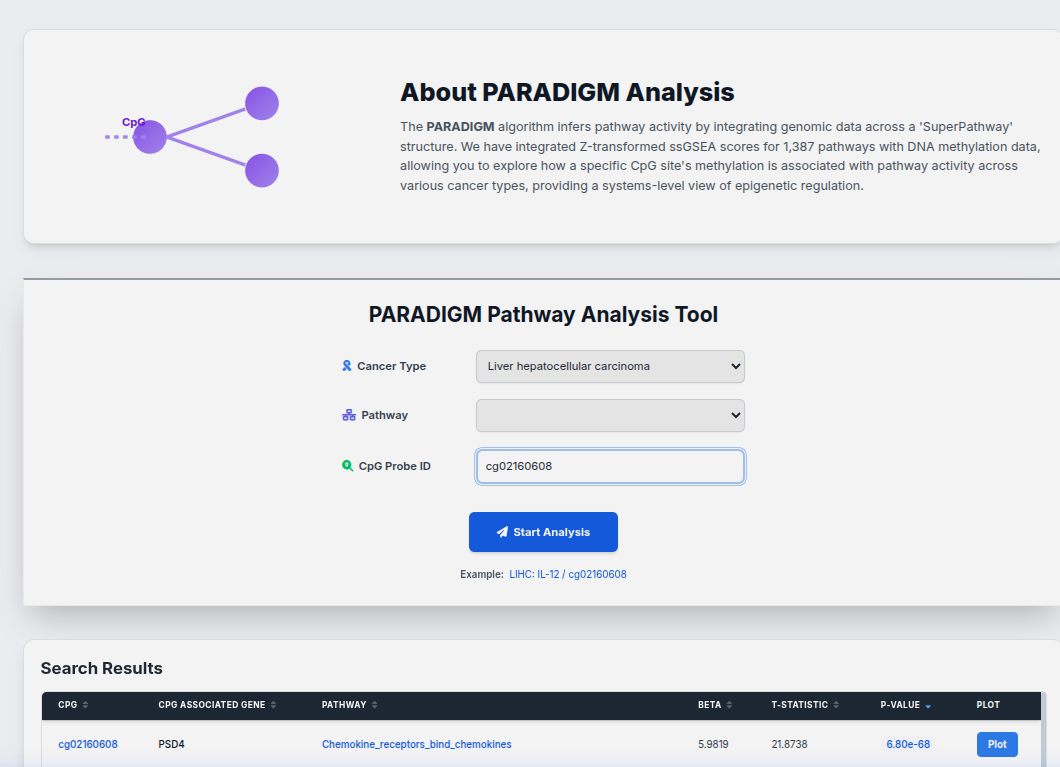
PARADIGM Pathway Analysis
Link methylation changes to the activity of biological pathways inferred by the PARADIGM algorithm.
Step 1: Search & Filter
Select a cancer type and optionally filter by Pathway Name or Gene Symbol.
Step 2: View Results
The results table displays significant associations. Click "Plot" to visualize.
Step 3: Interactive Visualization
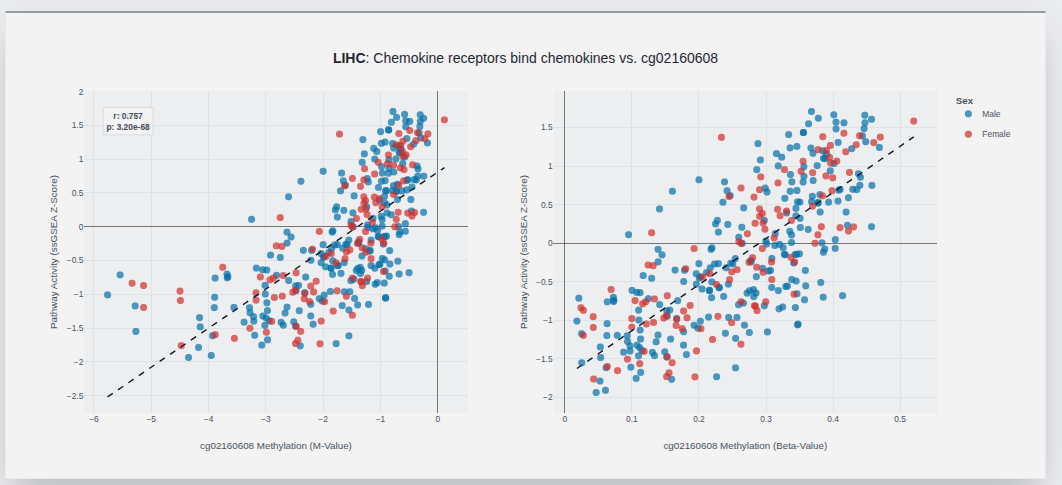
- X-Axis: DNA Methylation (Beta Value)
- Y-Axis: Pathway Activity Score
- Correlation: Correlation indicates regulatory link between the CpG site and pathway activation.
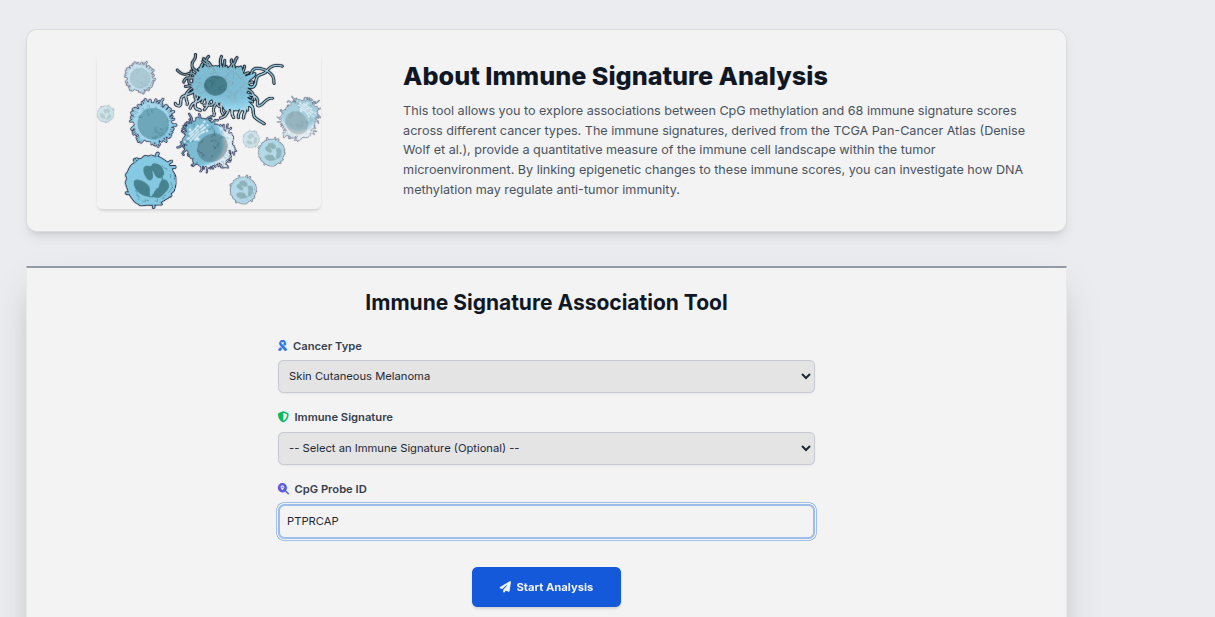
Immune Infiltration Analysis
Investigate how methylation levels correlate with the abundance of immune cell populations in the tumor microenvironment.
Step 1: Search & Filter
Select a cancer type and optionally filter by Immune Cell Type or Gene Symbol.
Step 2: View Results
The results table displays significant associations. Click "Plot" to visualize.
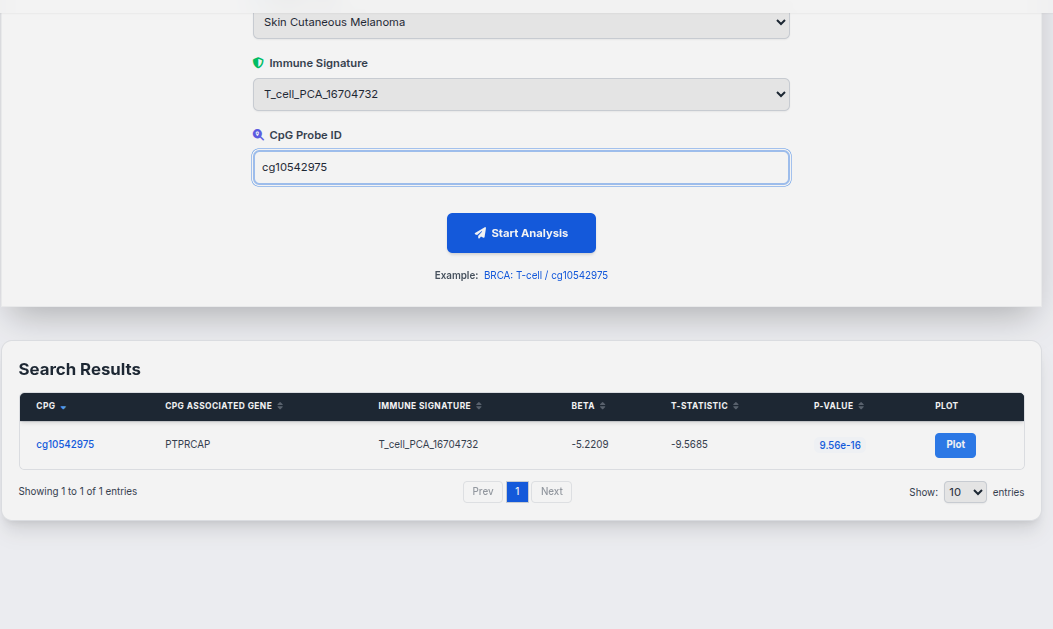
Step 3: Interactive Visualization
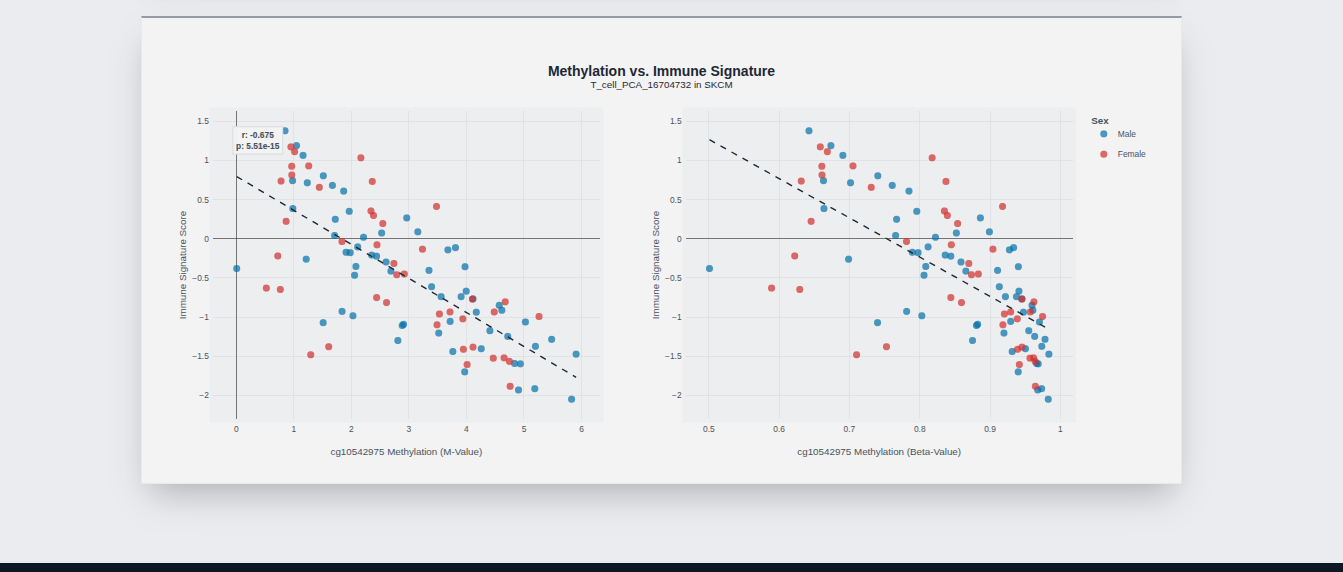
- X-Axis: DNA Methylation (Beta Value)
- Y-Axis: Immune Infiltration Score
- Correlation: Positive correlation suggests methylation promotes immune cell infiltration.