Visualize CD Data
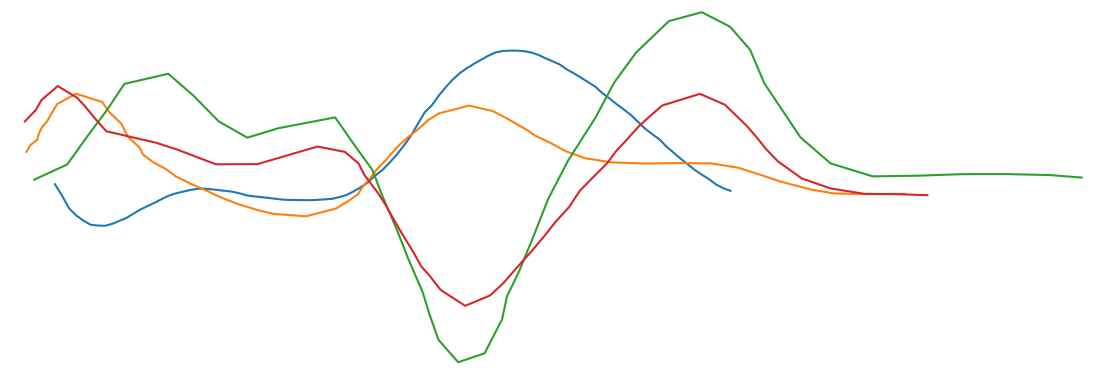
Select Spectra ID to Plot
Select Spectra ID to Plot
* Refer table for Y-axis unit(s)
Filter Options
Search the collection
Match all or part of an identifier.
Search expanded or compressed sequence text.
Paste a DOI link or search part of a DOI.
Experimental conditions & data quality pH, temperature, salt, buffer and quality
| Select | Quality | Reference ID | Nucleic acid | Secondary structure | pH | Temperature | Salt | Buffer | Unit |
|---|
Showing results...
Page 1 of 1