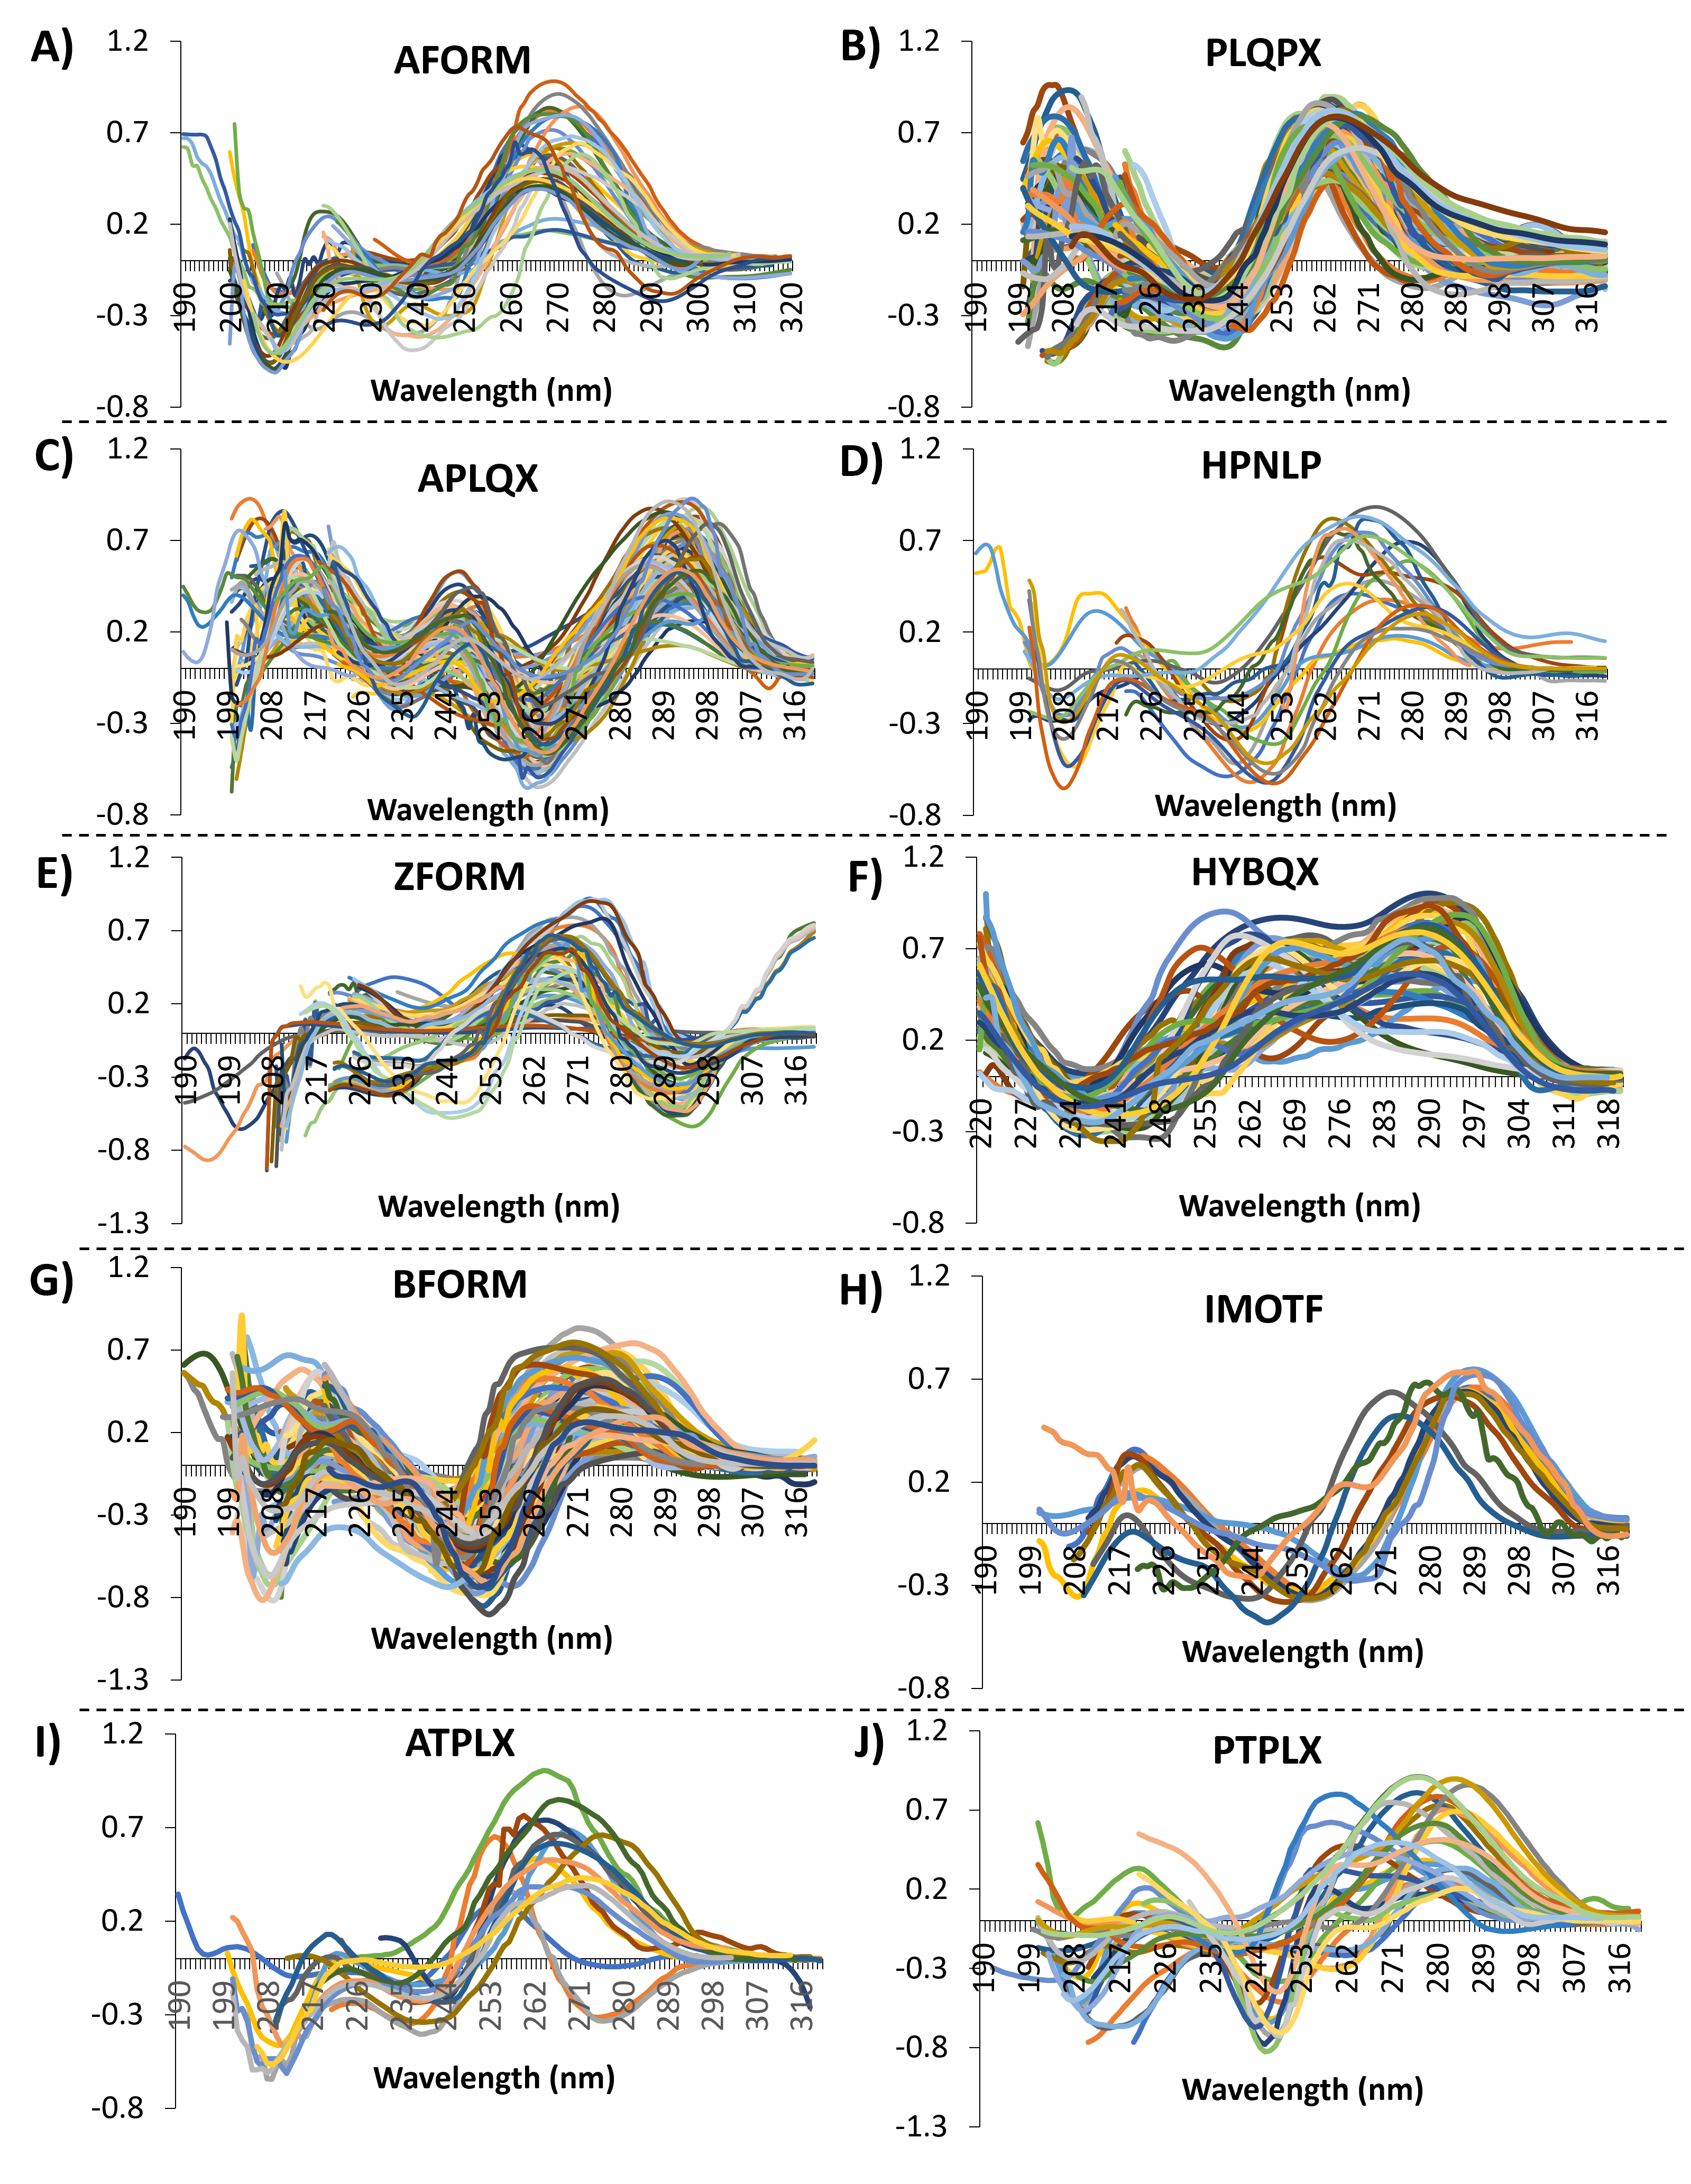
| Structural class |
Signature feature |
Minimum wavelength (nm) |
Maximum wavelength (nm) |
Mean wavelength (nm) |
Standard Deviation wavelength (nm) |
Maximum absolute shift (nm) |
Average shift (nm) |
| Hairpin (HPNLP) |
Positive peak near 270 nm |
264.000 |
277.000 |
270.313 |
4.222 |
6.688 |
3.563 |
| Negative trough near 240 nm |
233.000 |
247.000 |
241.917 |
3.679 |
8.917 |
2.611 |
| I-motif (IMOTF) |
Positive peak near 220 nm |
219.000 |
222.000 |
220.091 |
1.136 |
1.909 |
0.860 |
| Positive peak near 285 nm |
280.000 |
290.000 |
286.583 |
2.999 |
6.583 |
2.389 |
| Negative trough near 255 nm |
251.000 |
257.000 |
255.143 |
1.952 |
4.143 |
1.265 |
| AFORM |
Positive peak near 225 nm |
220.000 |
228.000 |
224.476 |
2.040 |
4.476 |
1.596 |
| Positive peak near 265 nm |
261.000 |
272.000 |
267.205 |
2.966 |
6.205 |
2.405 |
| Negative trough near 210 nm (RNA signature) |
208.000 |
213.000 |
210.292 |
1.517 |
2.708 |
1.257 |
| Negative trough near 240 nm |
235.000 |
247.000 |
240.485 |
3.337 |
6.515 |
2.680 |
| ZFORM |
Positive peak near 220 nm |
215.000 |
227.000 |
221.383 |
3.138 |
6.383 |
2.588 |
| Positive peak near 270 nm |
263.000 |
277.000 |
268.851 |
3.716 |
8.149 |
3.106 |
| Negative trough near 235 nm |
229.000 |
241.000 |
236.271 |
3.367 |
7.271 |
2.874 |
| Negative trough near 290 nm |
283.000 |
297.000 |
292.598 |
2.833 |
9.598 |
2.202 |
| BFORM |
Positive peak near 275 nm |
268.000 |
282.000 |
275.810 |
3.582 |
7.810 |
2.821 |
| Negative trough near 245 nm |
238.000 |
252.000 |
246.435 |
4.049 |
8.435 |
3.421 |
| Hybrid quadruplex (HYBQX) |
Positive peak near 265 nm |
258.000 |
272.000 |
266.091 |
3.591 |
8.091 |
2.755 |
| Positive peak near 290 nm |
285.000 |
297.000 |
290.750 |
2.712 |
6.250 |
2.170 |
| Negative trough near 240 nm |
233.000 |
247.000 |
238.329 |
3.278 |
8.671 |
2.585 |
| Parallel quadruplex (PLQPX) |
Positive peak near 263 nm |
254.000 |
275.000 |
263.324 |
3.143 |
11.676 |
2.229 |
| Negative trough near 239 nm |
225.000 |
250.000 |
239.559 |
3.549 |
14.559 |
2.585 |
| Positive peak near 210 nm |
205.000 |
215.000 |
209.867 |
3.493 |
5.133 |
2.946 |
| Negative trough near 210 nm (RNA signature) |
205.000 |
215.000 |
211.587 |
4.427 |
6.587 |
4.107 |
| Anti-parallel quadruplex (APLQX) |
Positive peak near 295 nm |
284.000 |
301.000 |
293.311 |
3.369 |
9.311 |
2.614 |
| Positive peak near 245 nm |
235.000 |
255.000 |
244.874 |
4.578 |
10.126 |
3.449 |
| Negative trough near 263 nm |
255.000 |
273.000 |
263.067 |
3.219 |
9.933 |
2.281 |
| Negative trough near 233 nm |
225.000 |
240.000 |
232.992 |
3.552 |
7.992 |
2.675 |
| Anti-parallel triplex (ATPLX) |
Positive peak near 267 nm |
260.000 |
274.000 |
265.750 |
4.539 |
8.250 |
3.656 |
| Positive peak near 223 nm |
216.000 |
230.000 |
224.200 |
3.489 |
8.200 |
2.613 |
| Negative trough near 238 nm |
231.000 |
245.000 |
238.875 |
3.538 |
7.875 |
2.391 |
| Negative trough near 210 nm |
208.000 |
216.000 |
211.000 |
2.449 |
5.000 |
2.000 |
| Parallel triplex (PTPLX) |
Positive peak near 280 nm |
273.000 |
286.000 |
278.875 |
4.291 |
7.067 |
3.676 |
| Positive peak near 225 nm |
218.000 |
232.000 |
225.967 |
4.507 |
7.967 |
3.838 |
| Negative trough near 242 nm |
235.000 |
249.000 |
243.267 |
5.179 |
8.267 |
4.649 |
| Negative trough near 207 nm |
204.000 |
214.000 |
209.917 |
2.903 |
5.917 |
2.347 |