User Manual
This page provides users with guidance on using RadGLO, a resource for exploring glioma-related radiology data. Below are detailed descriptions of different features and how to navigate through them. You can also click here to open the full User Manual.
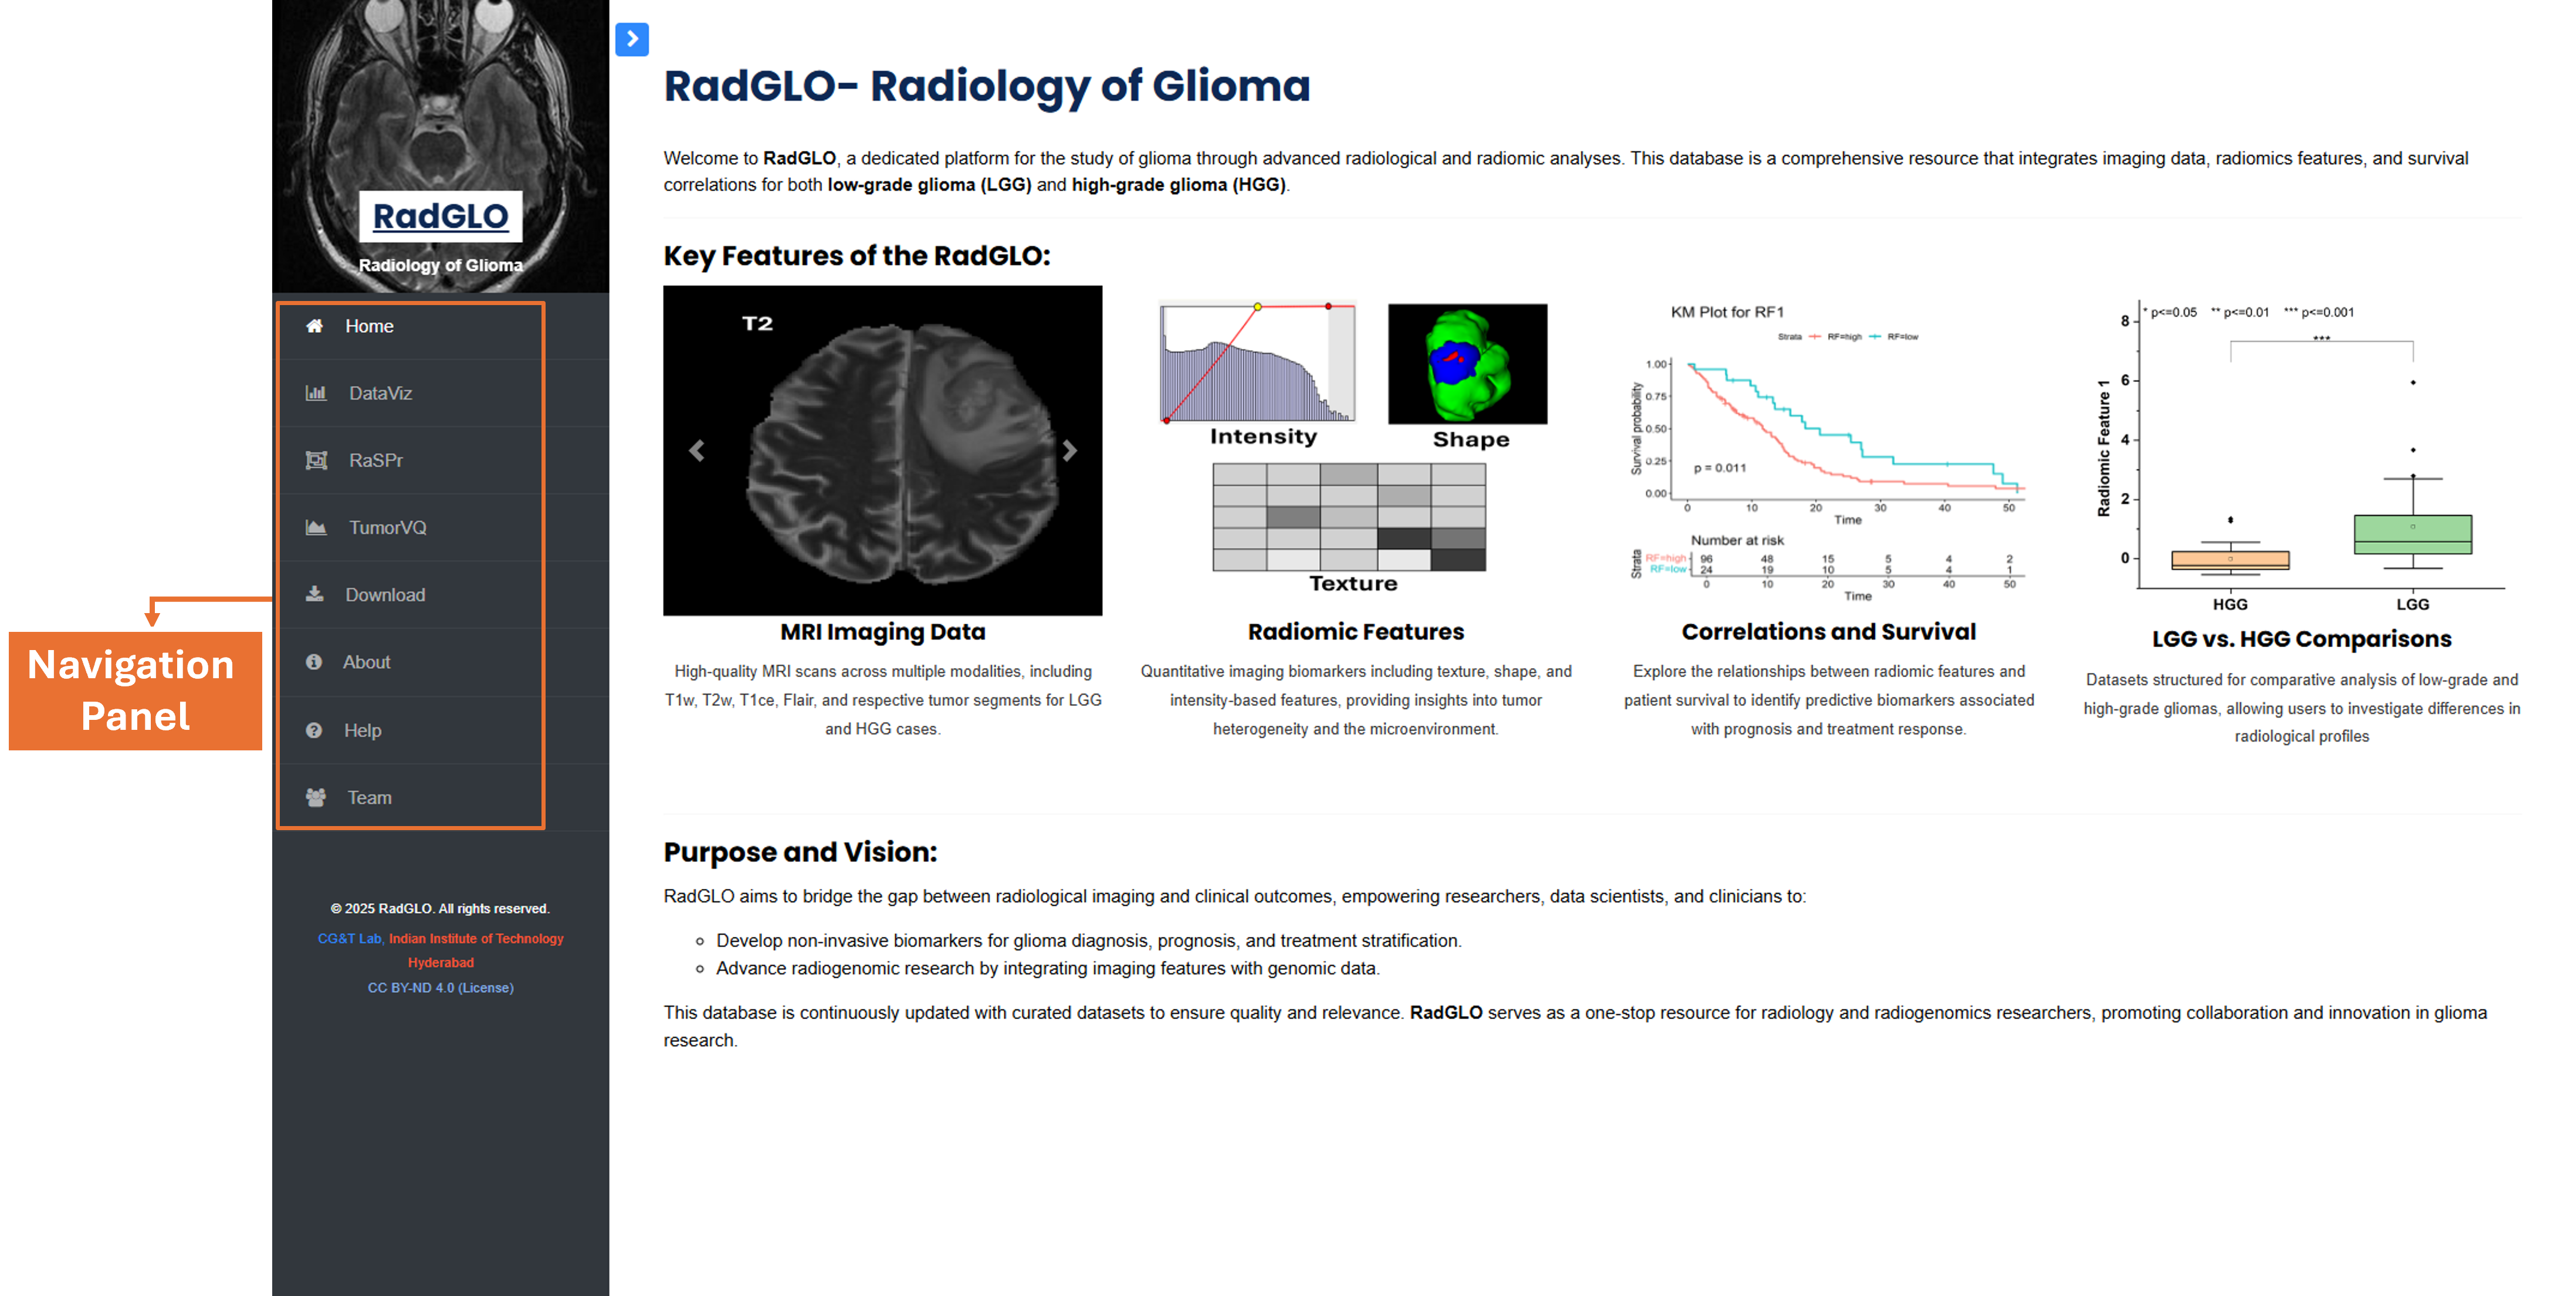
1. Home Page
The Home Page includes a navigation bar and provides users with an overview of AagingBase data. It also displays key statistics related to glioma research.
2. DataViz
The DataViz page offers comprehensive visualization of radiomic features across all datasets of GBM and LGG through survival analysis, comparative analysis, correlation analysis, and feature visualization via heatmaps.
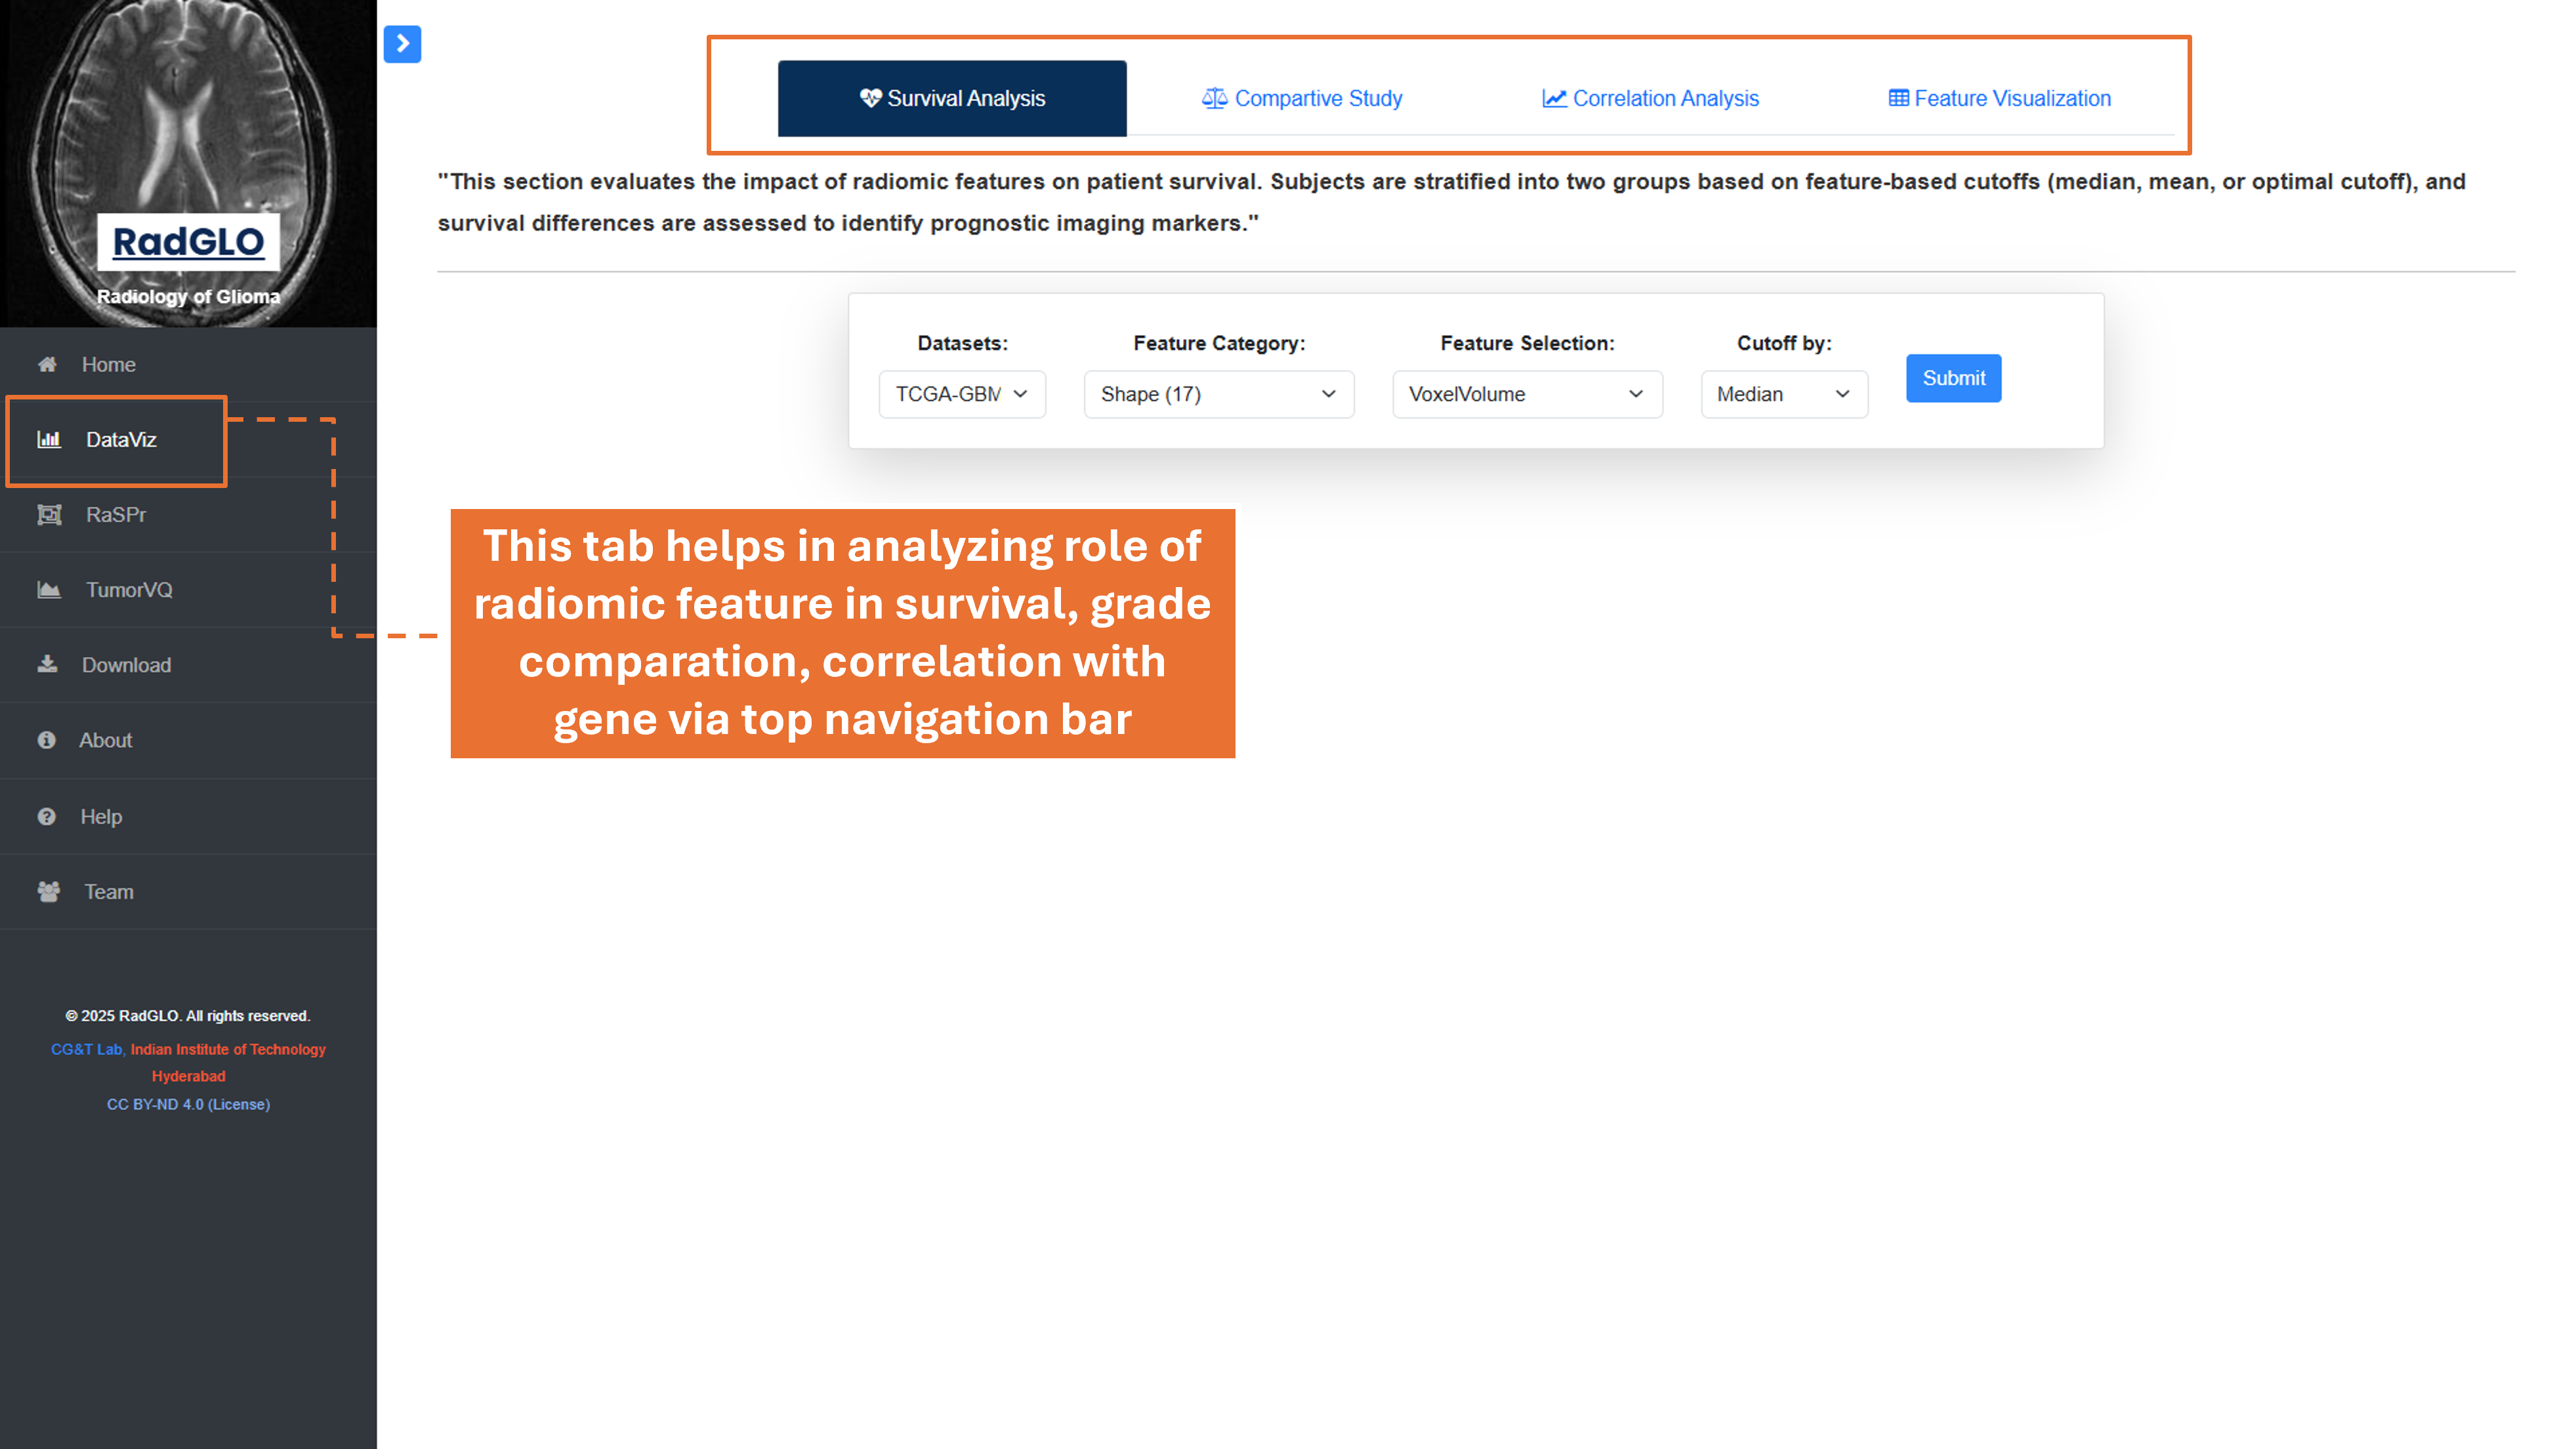
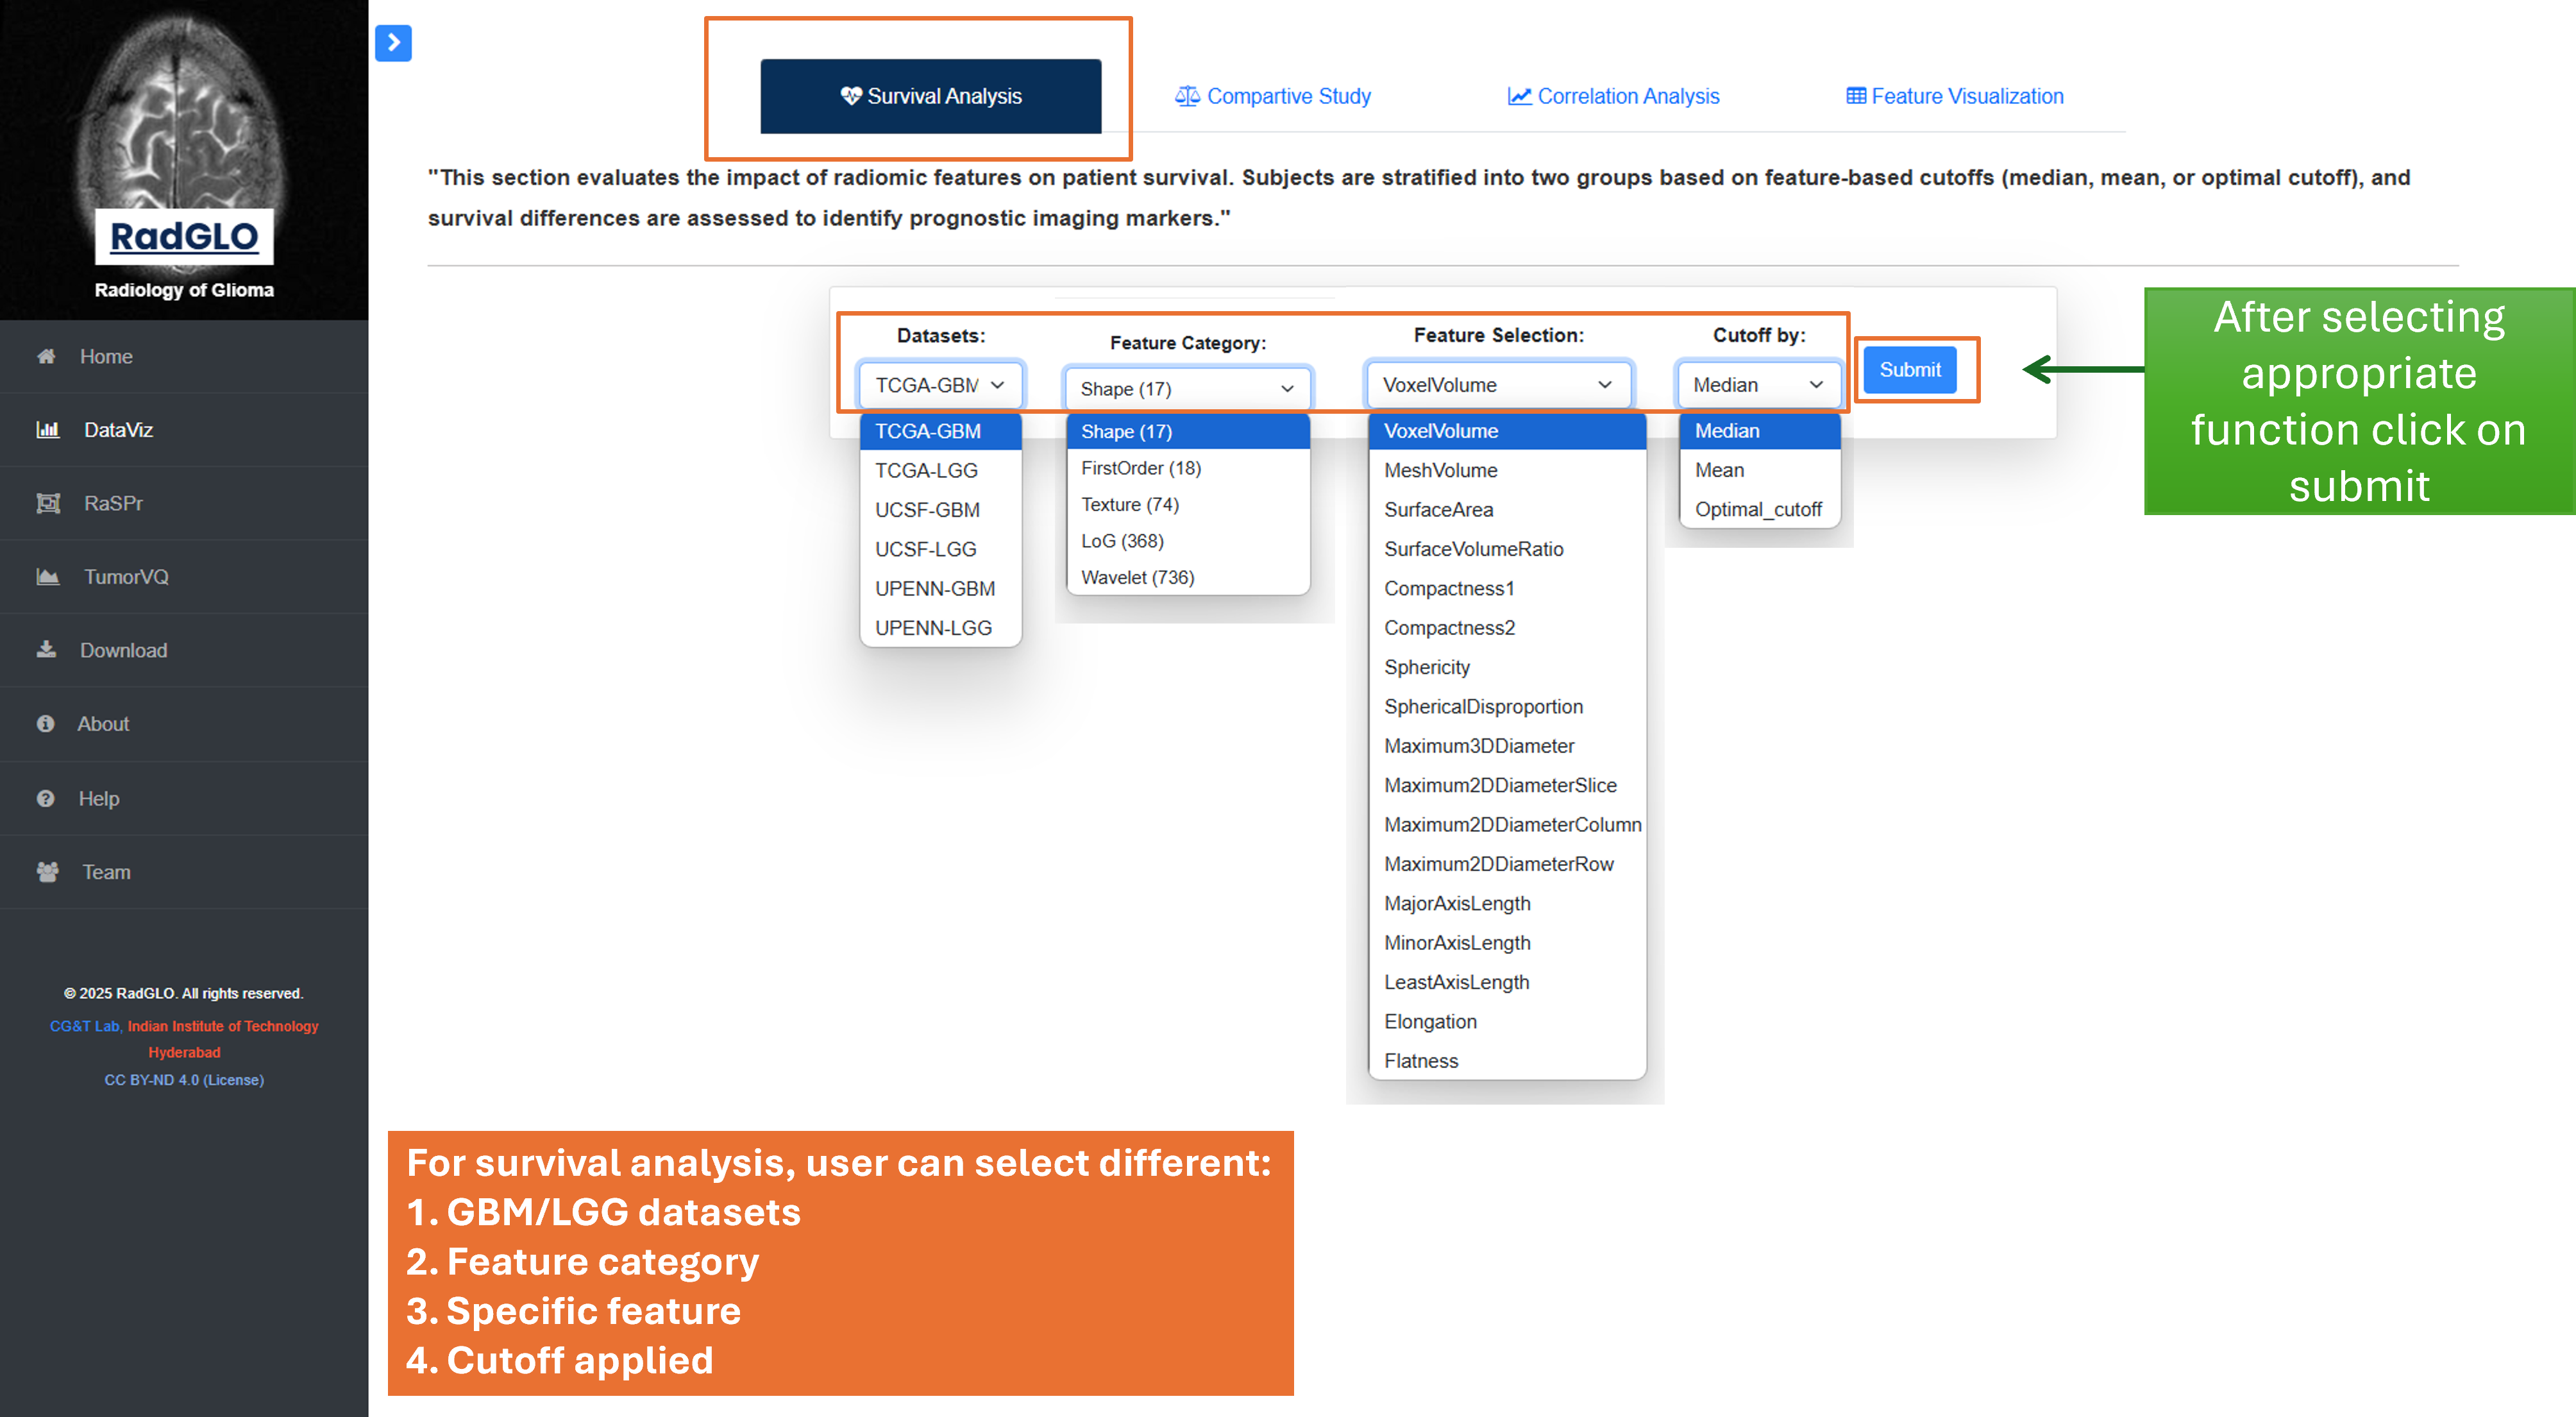
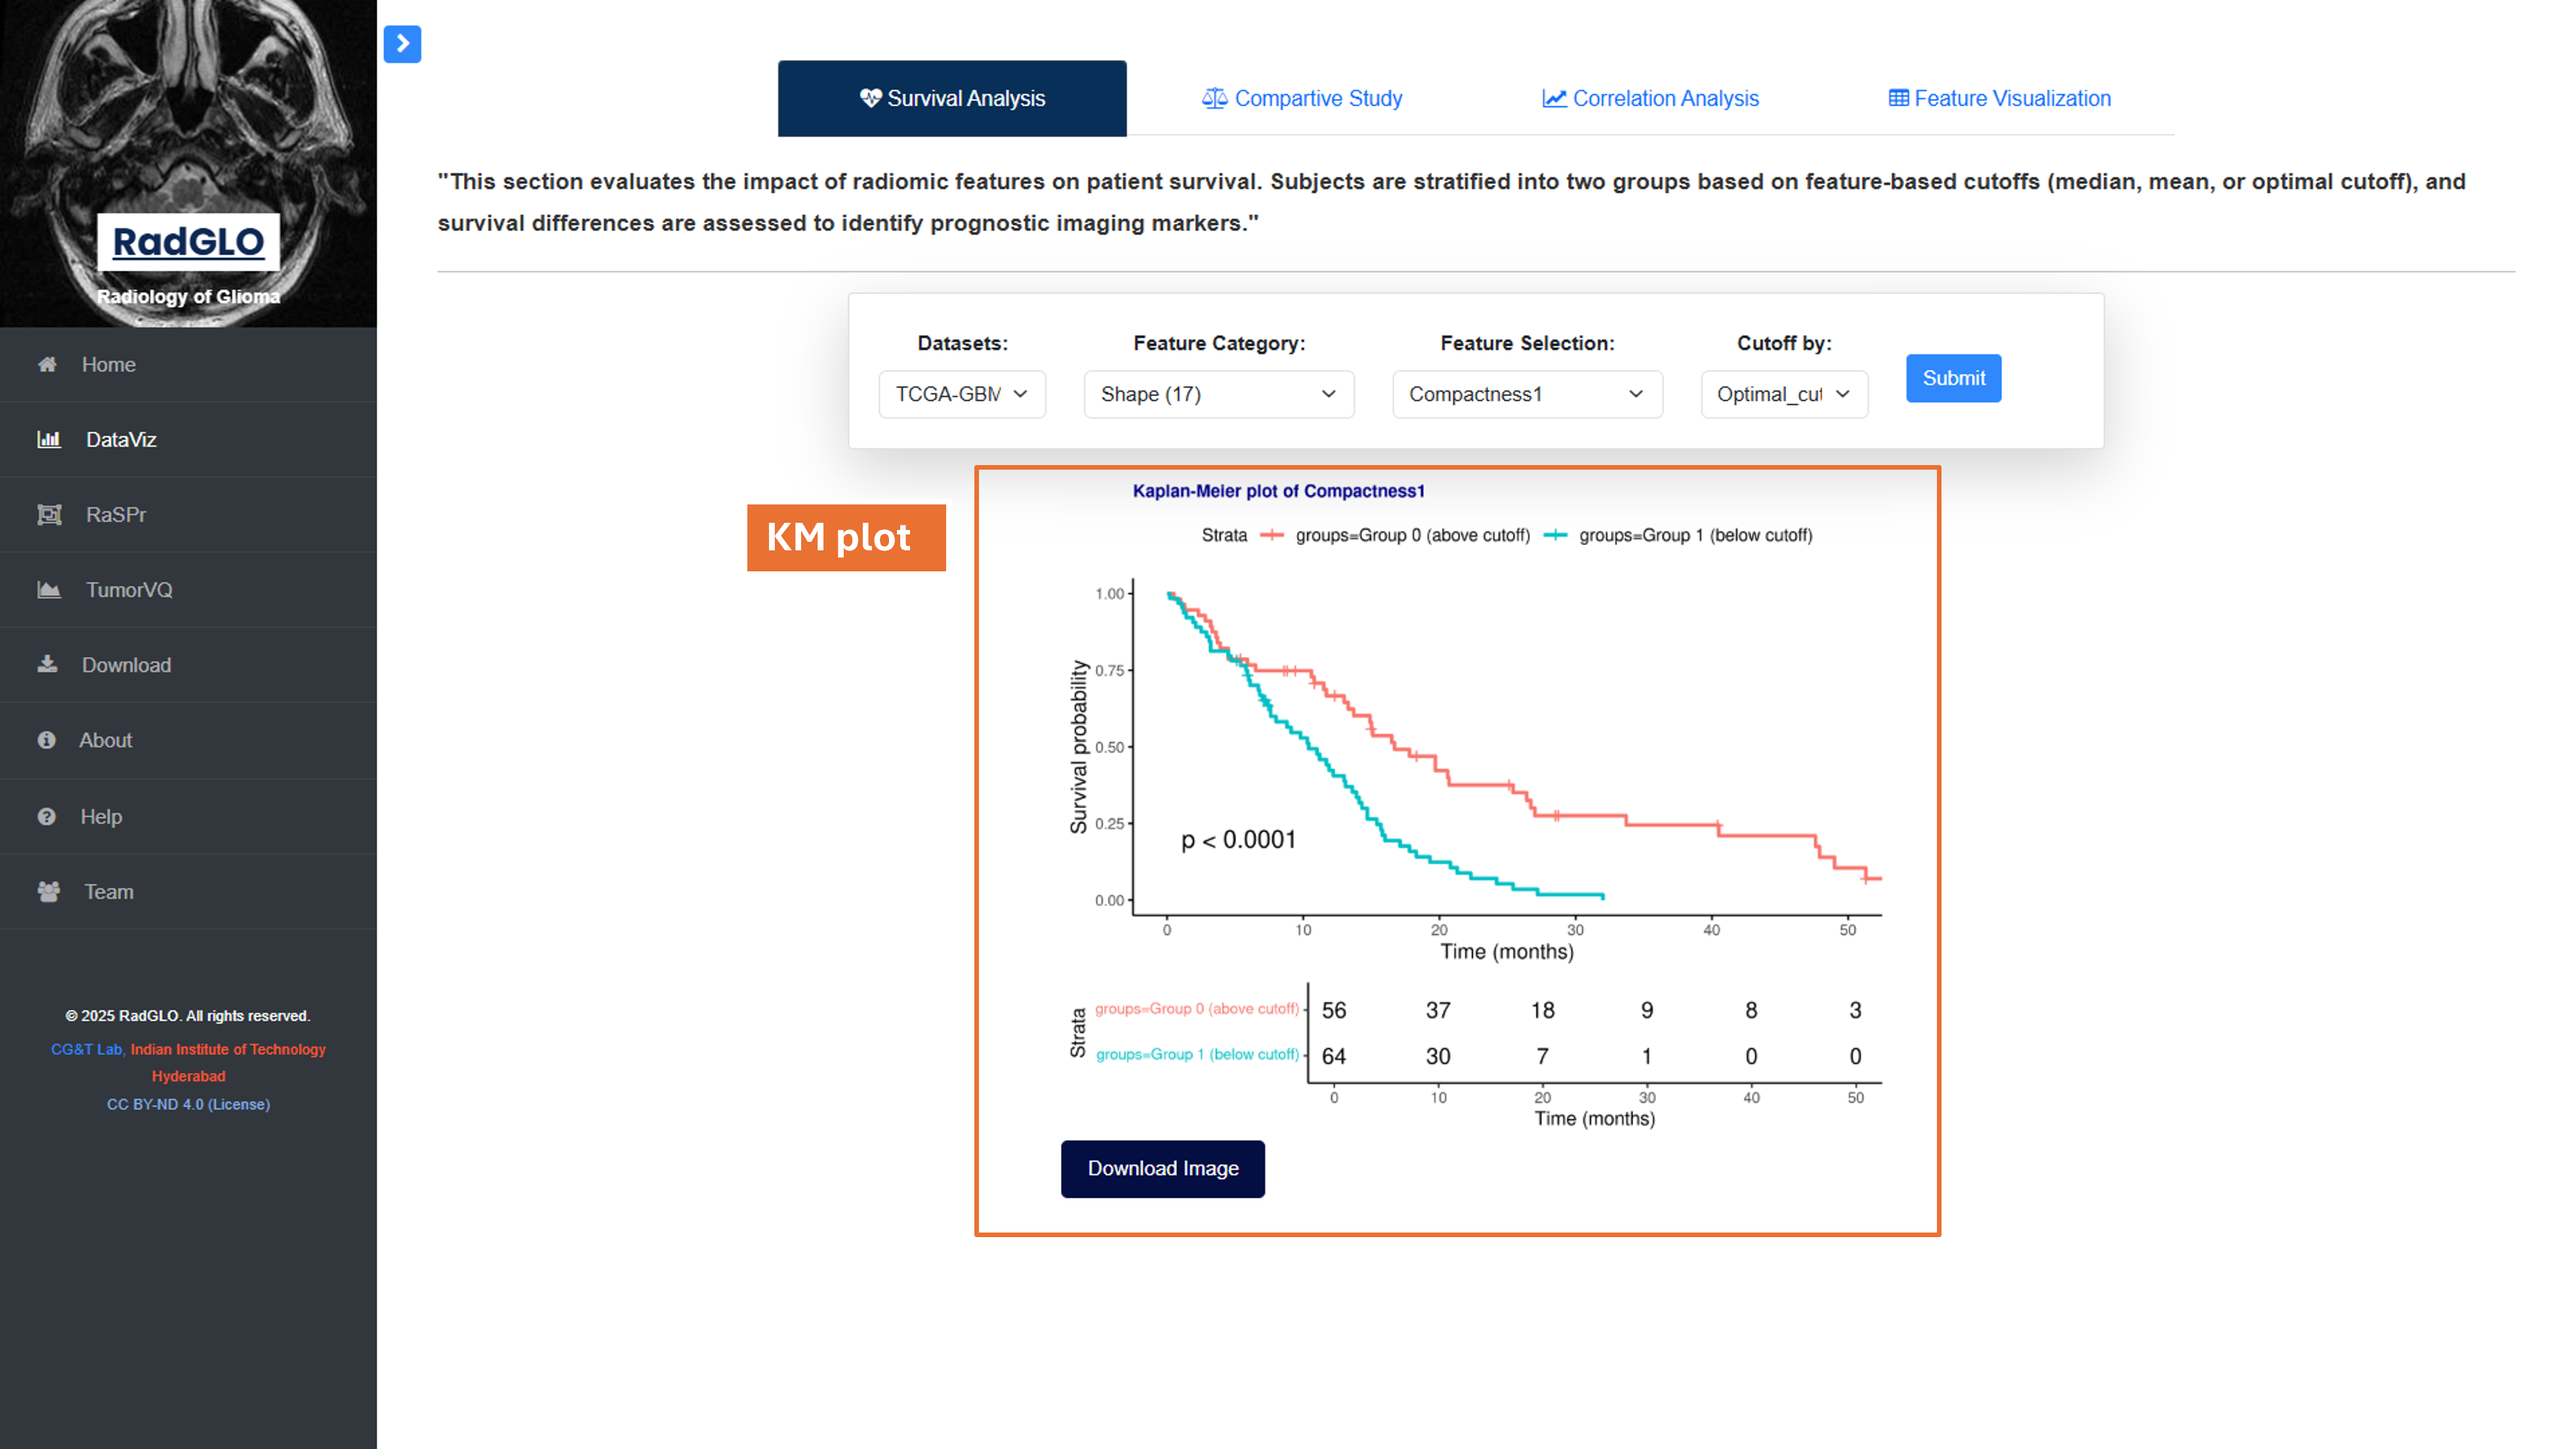
2.1 Survival Analysis
Users can select different datasets, features, and cutoff methods to stratify groups. Group 0 represents patients with feature values above the cutoff; Group 1 represents those below.
2.1 Survival Analysis Results
Kaplan Meier plot showing stratifing samples based on optimal cutoff where Group1 showing poor survival (blue color) and Group0 showing good survival.
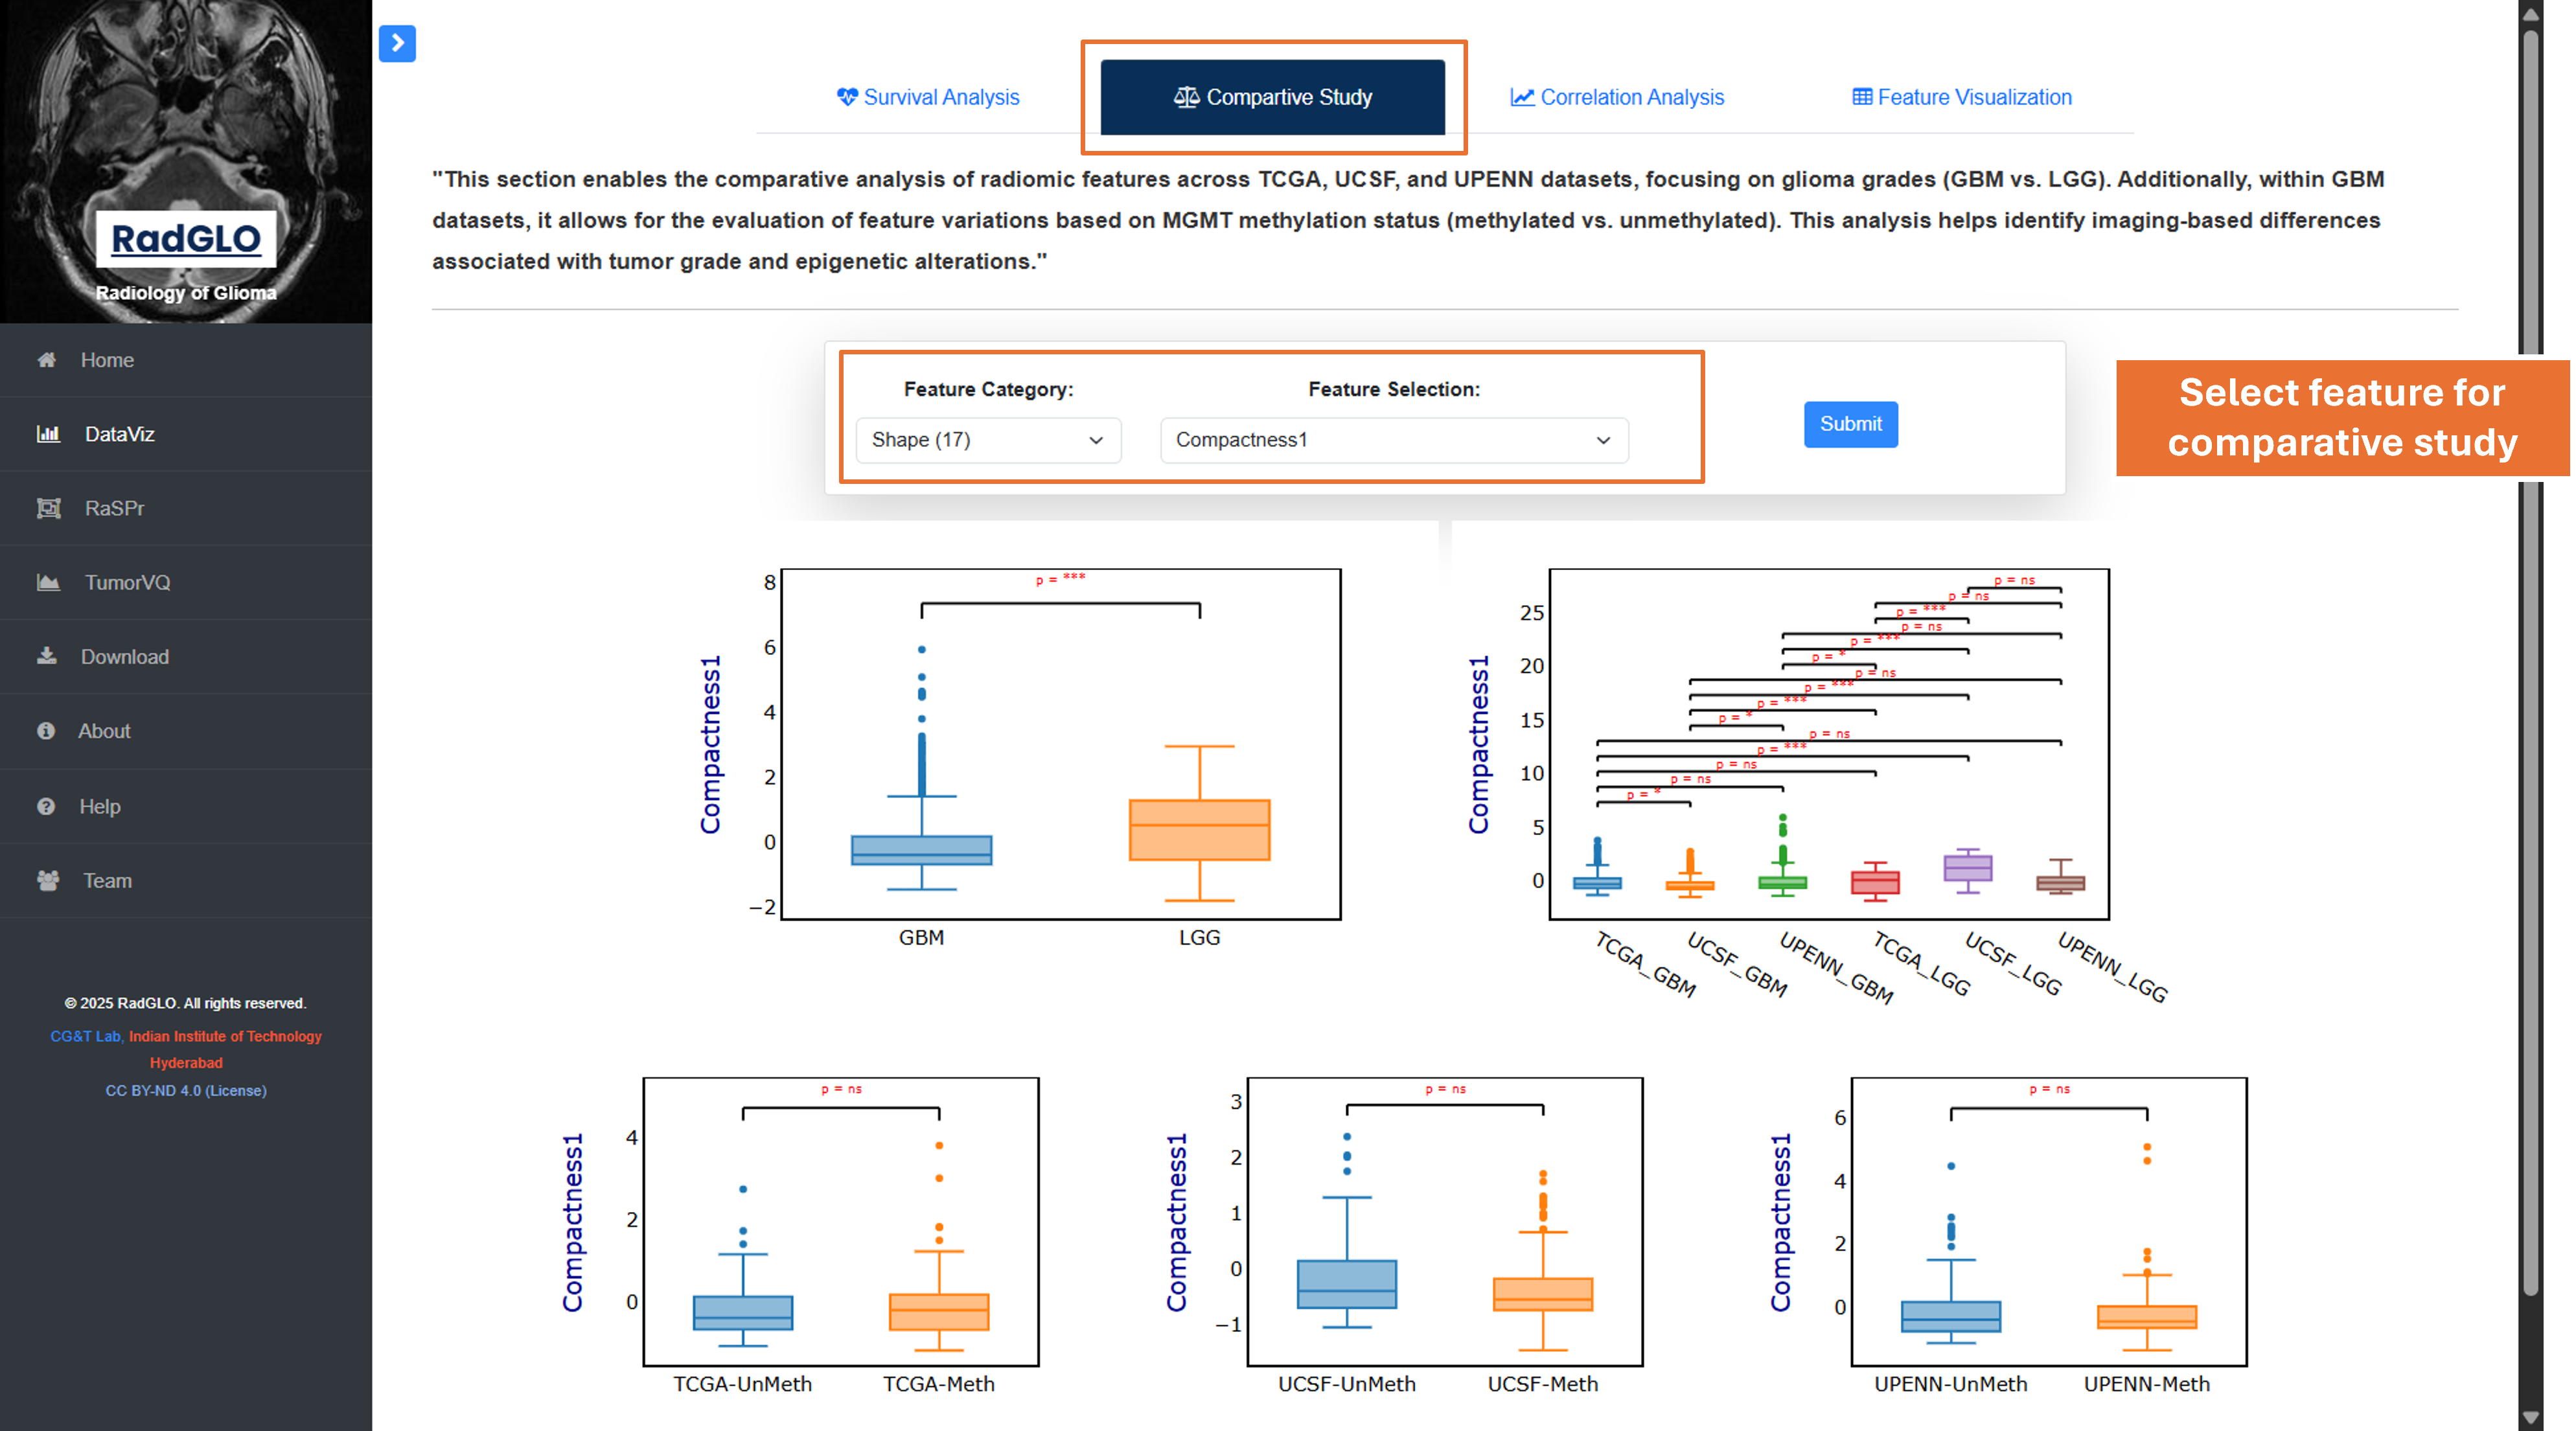
2.2 Comparative Analysis
Allows comparison of radiomic features across different groups (e.g., GBM vs. LGG) using statistical plots such as boxplots and bar charts.
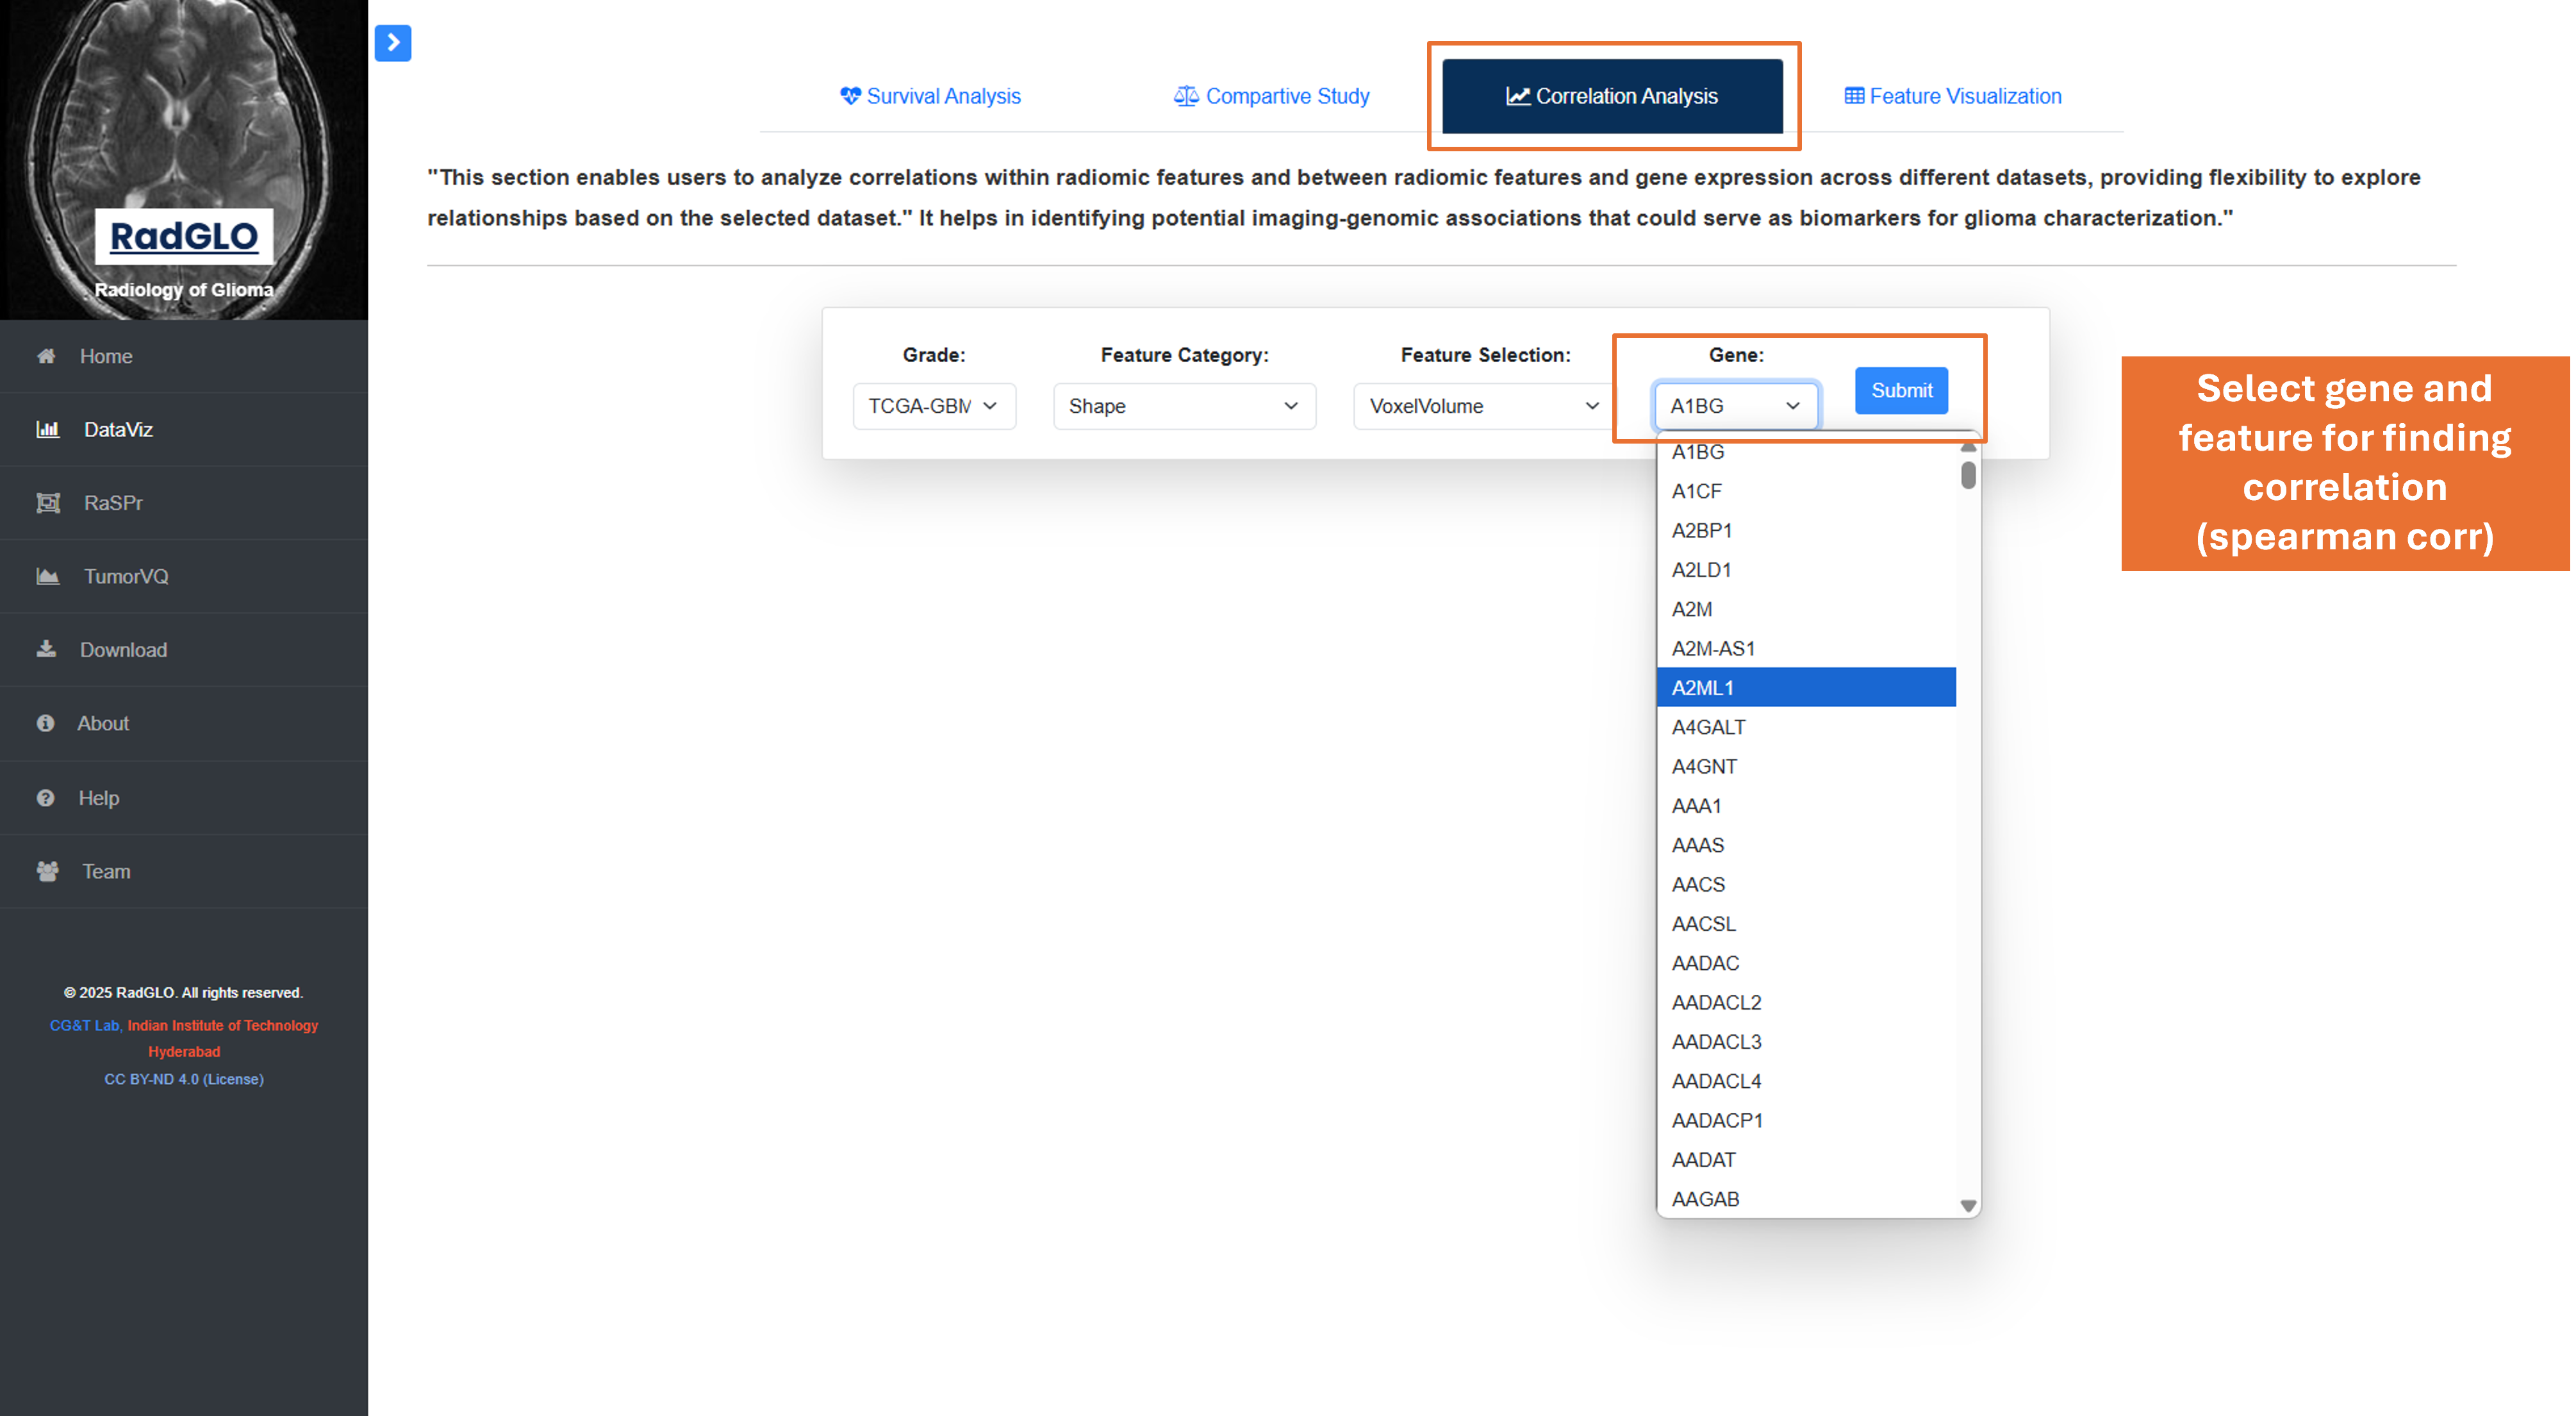
2.3 Correlation Analysis
This section shows correlations between radiomic features, helping users identify patterns or redundancies. Visualizations include correlation matrices and scatter plots.
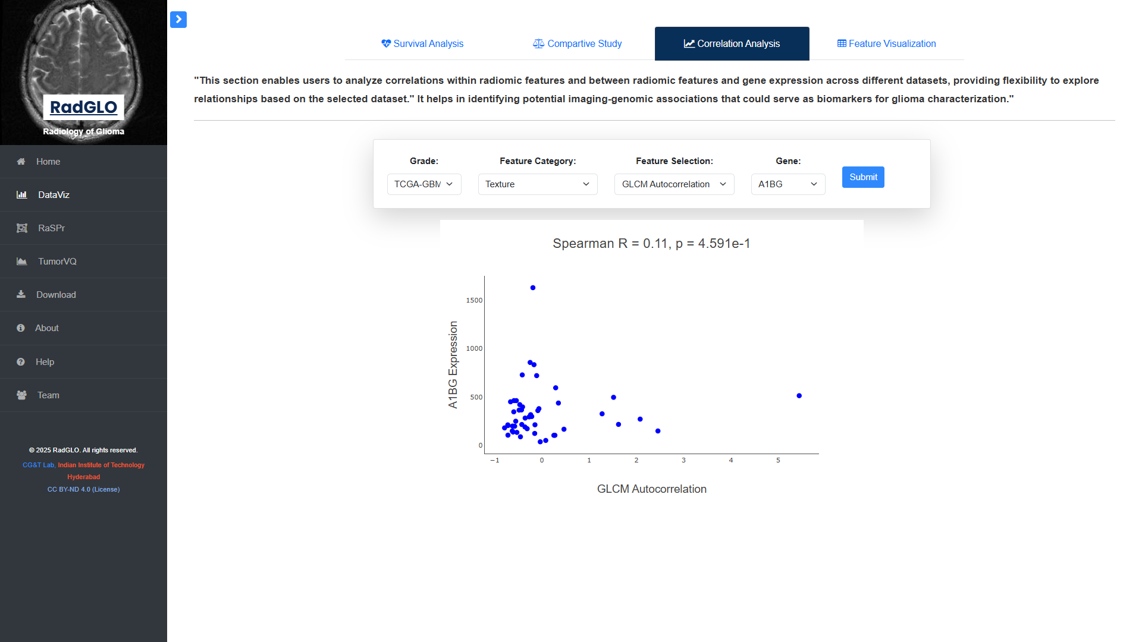
2.3 Correlation Analysis Results
This section shows correlations between radiomic features, helping users identify patterns or redundancies. Visualizations include correlation matrices and scatter plots.
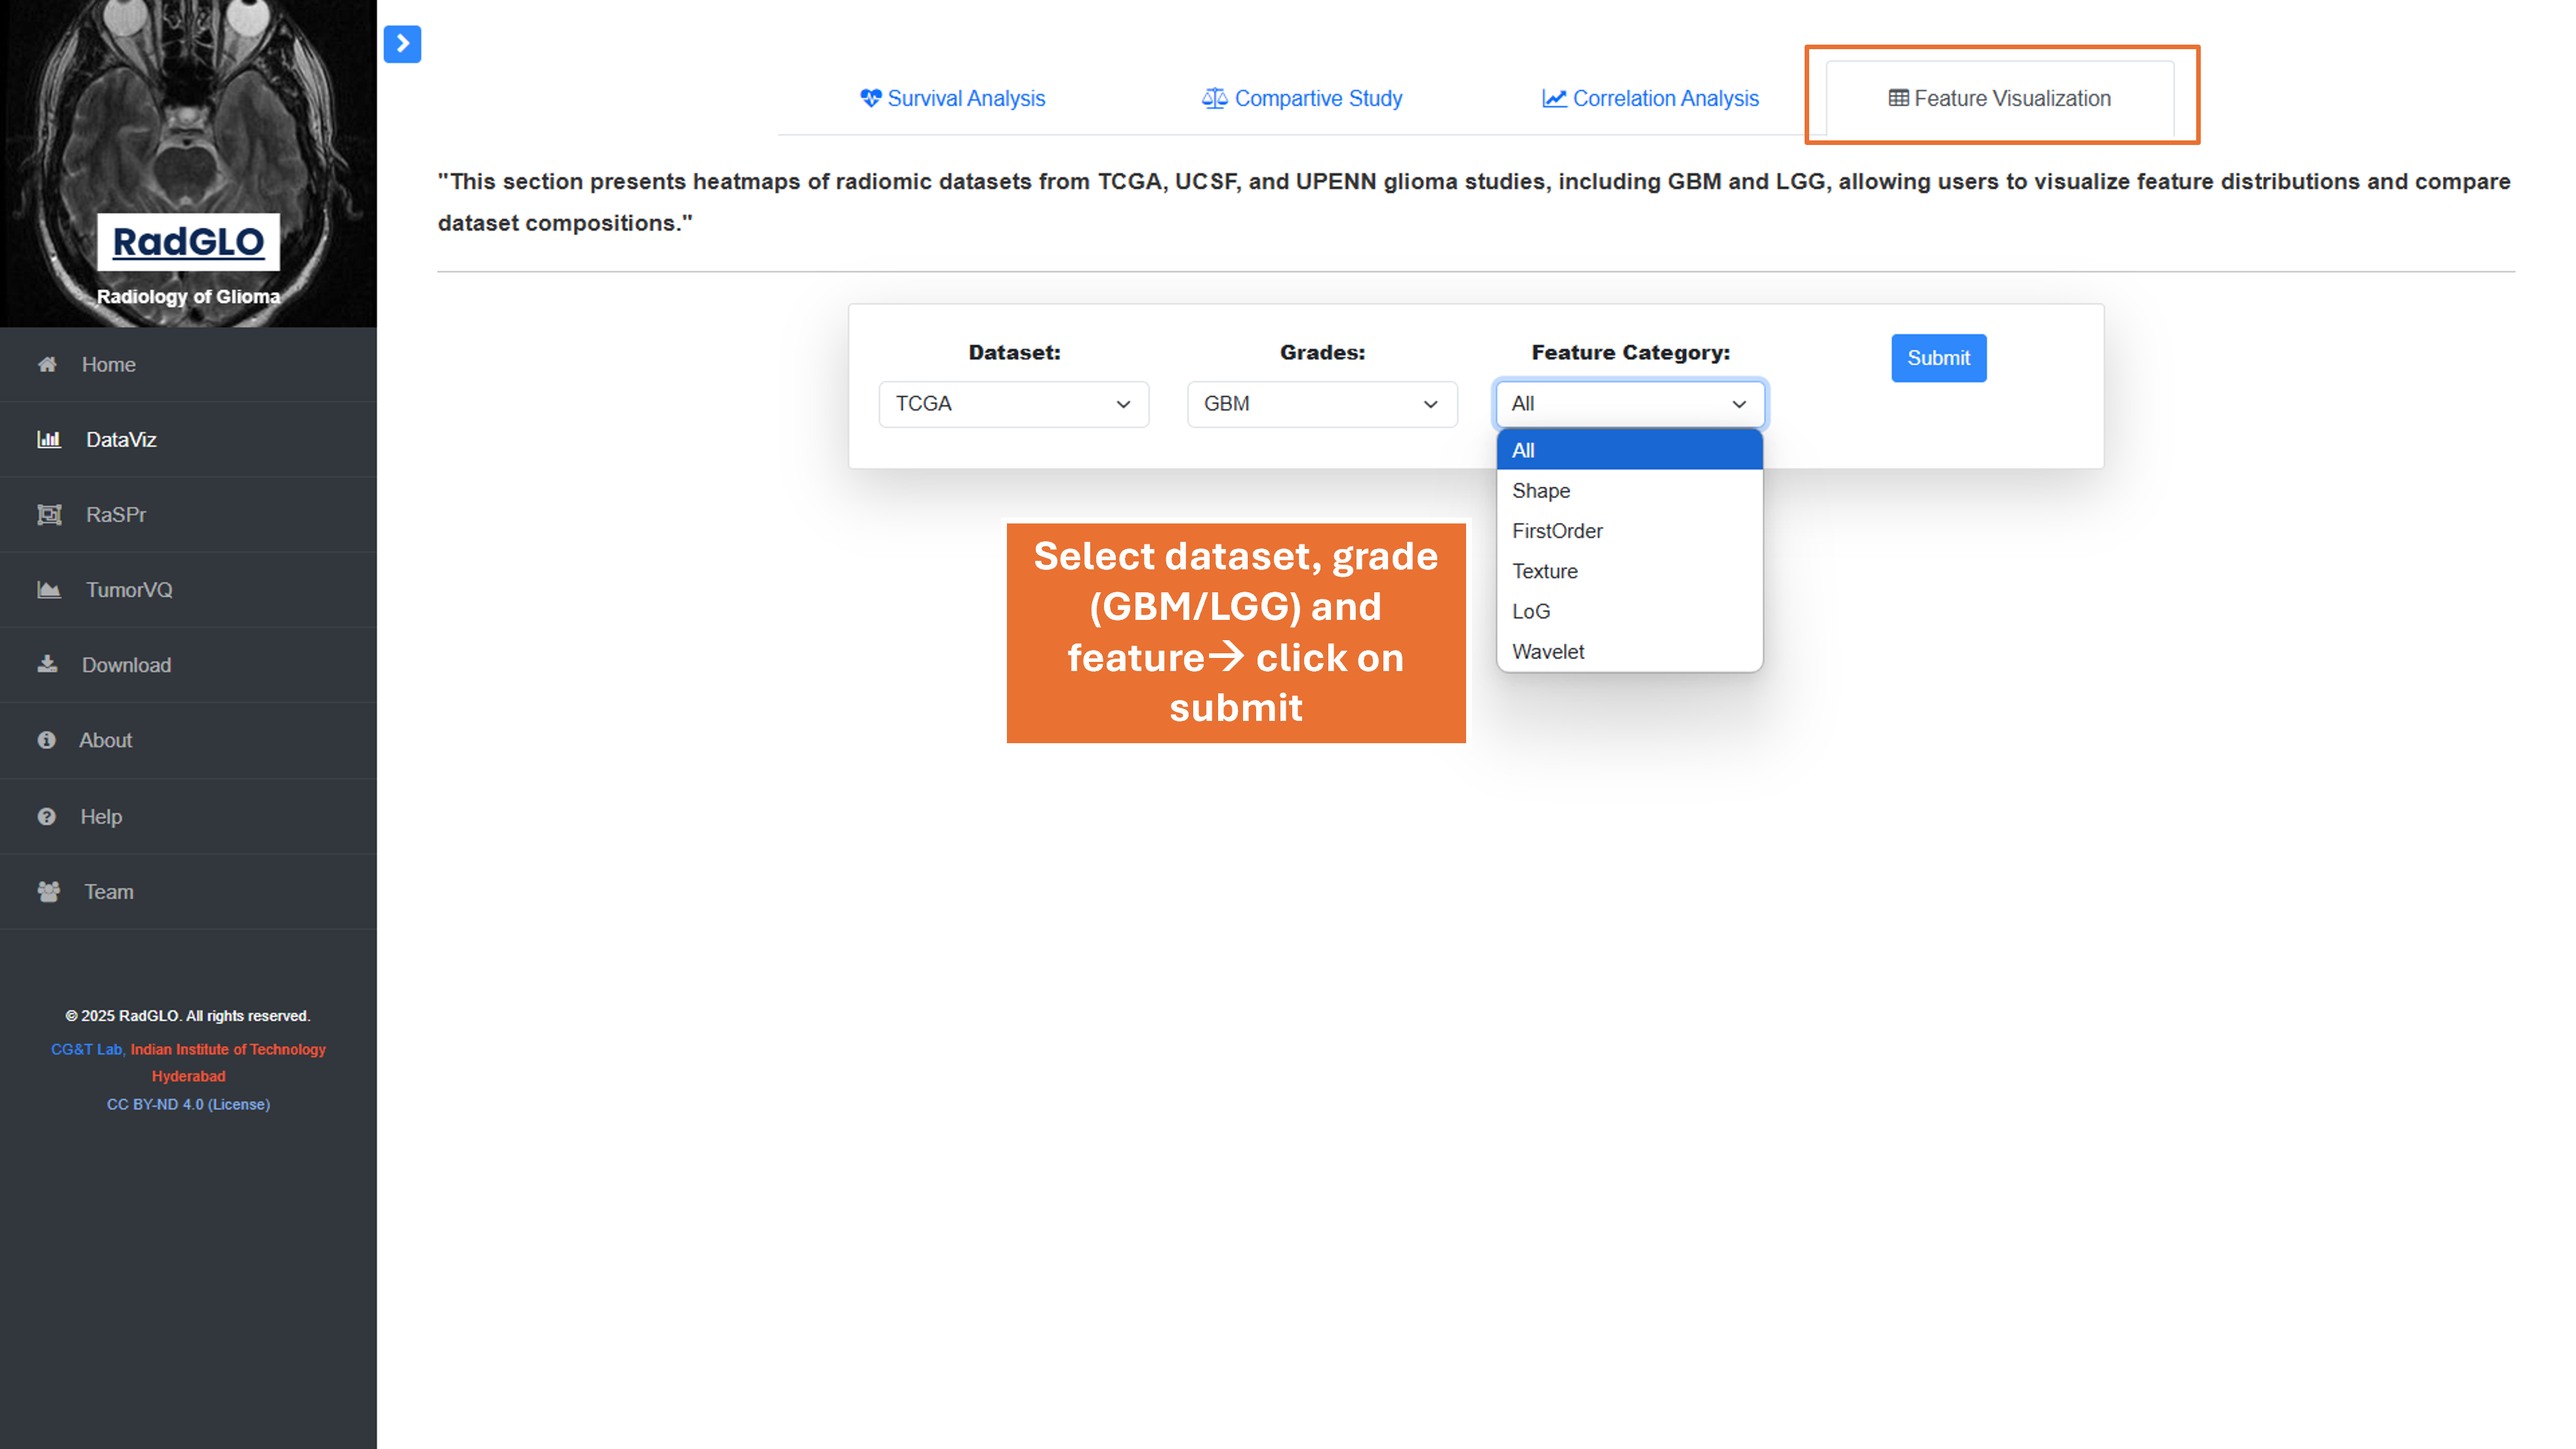
2.4 Feature Visualizations
Users can select features and datasets by tumor grade to visualize how feature values are distributed across those groups.
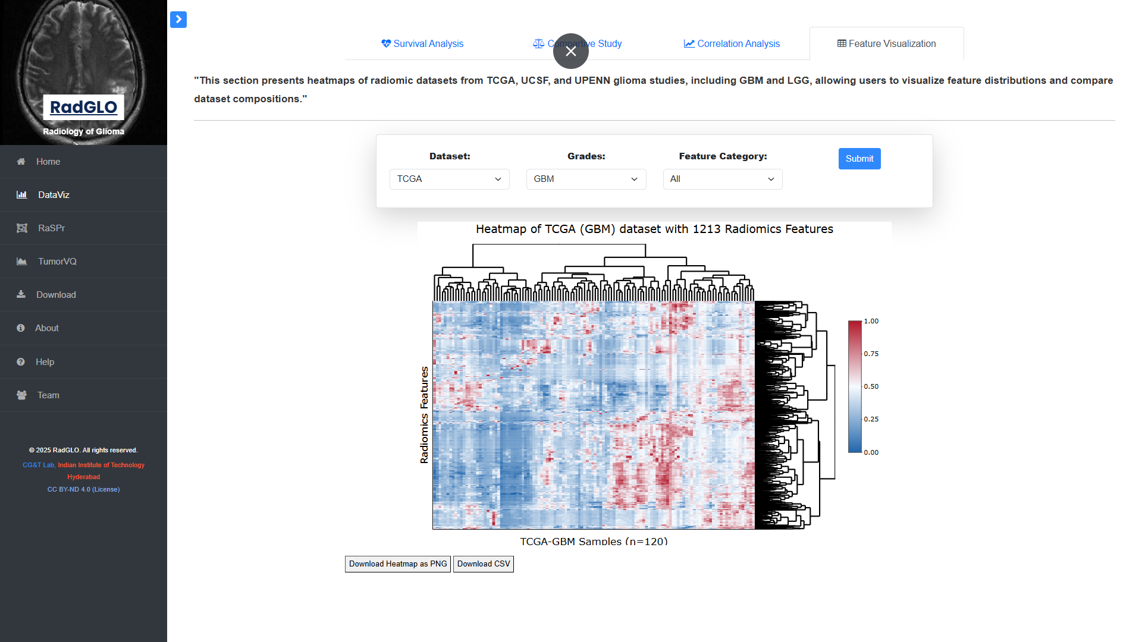
2.4 Feature Visualizations Results
Heatmap displaying feature intensity across selected samples and grades, helping identify distribution trends.
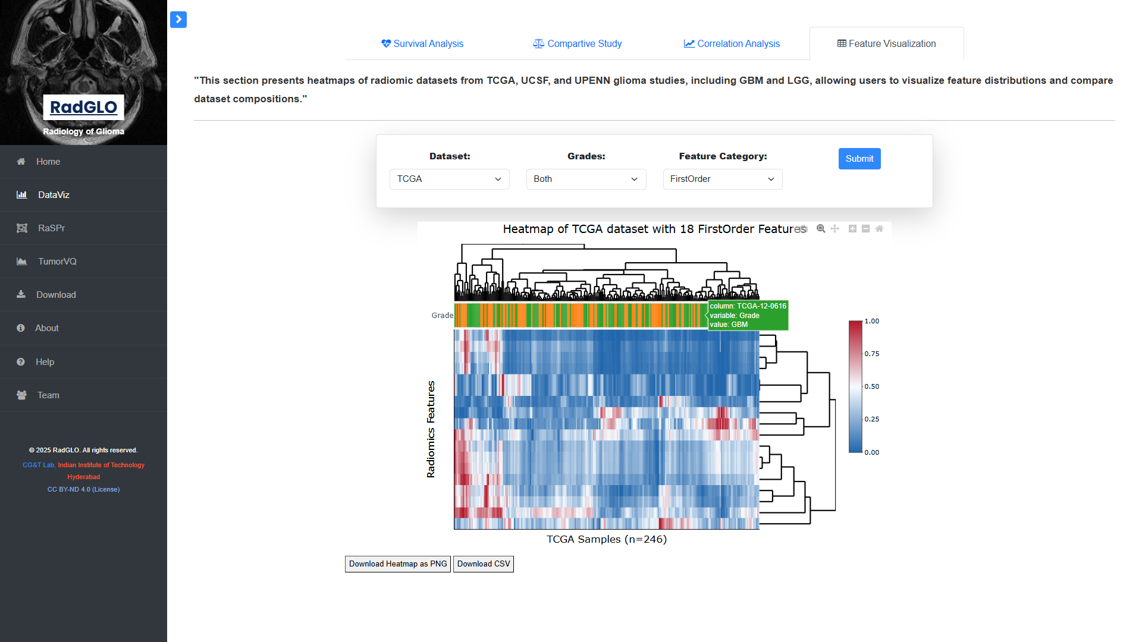
2.4 Feature Visualizations Results
Clustered heatmap with a top phenobar, color-coded by tumor grade: LGG (green) and GBM (yellow).
3 Radiomic Survival Predictor (RaSPr)
Overview of RaSPr module, developed for survival risk prediction using RadScore, featuring three different prediction approaches.
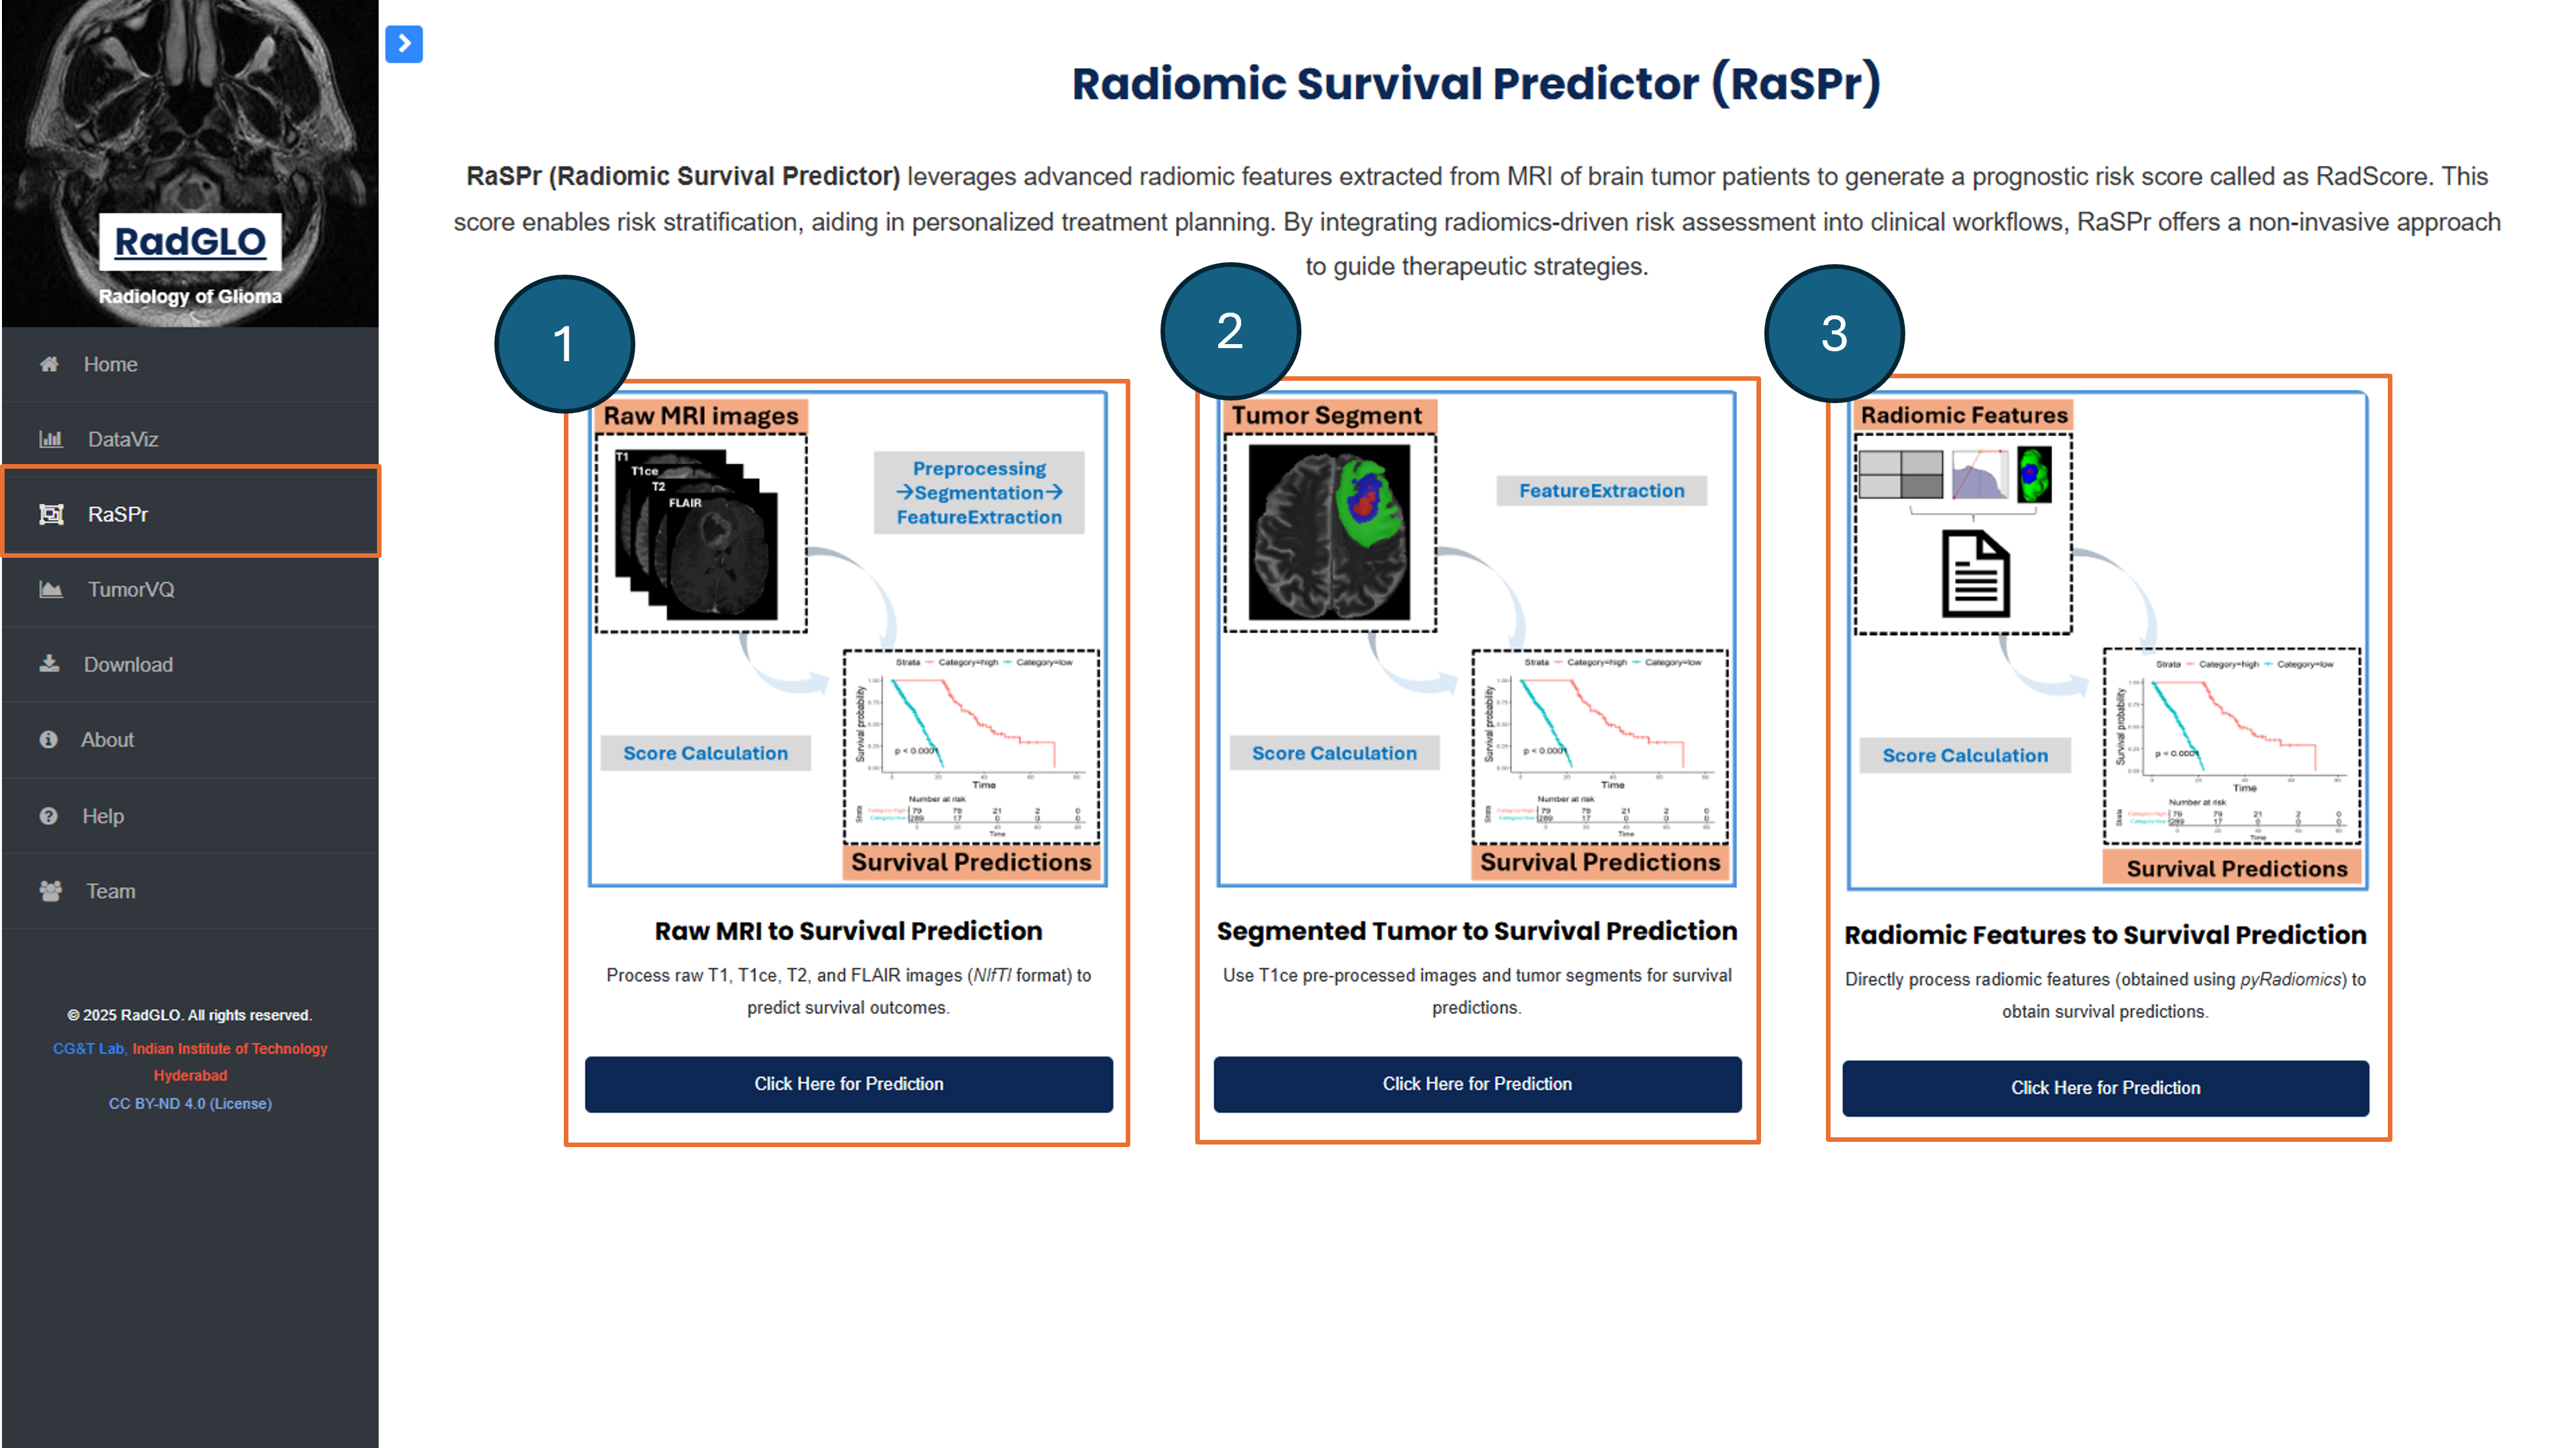
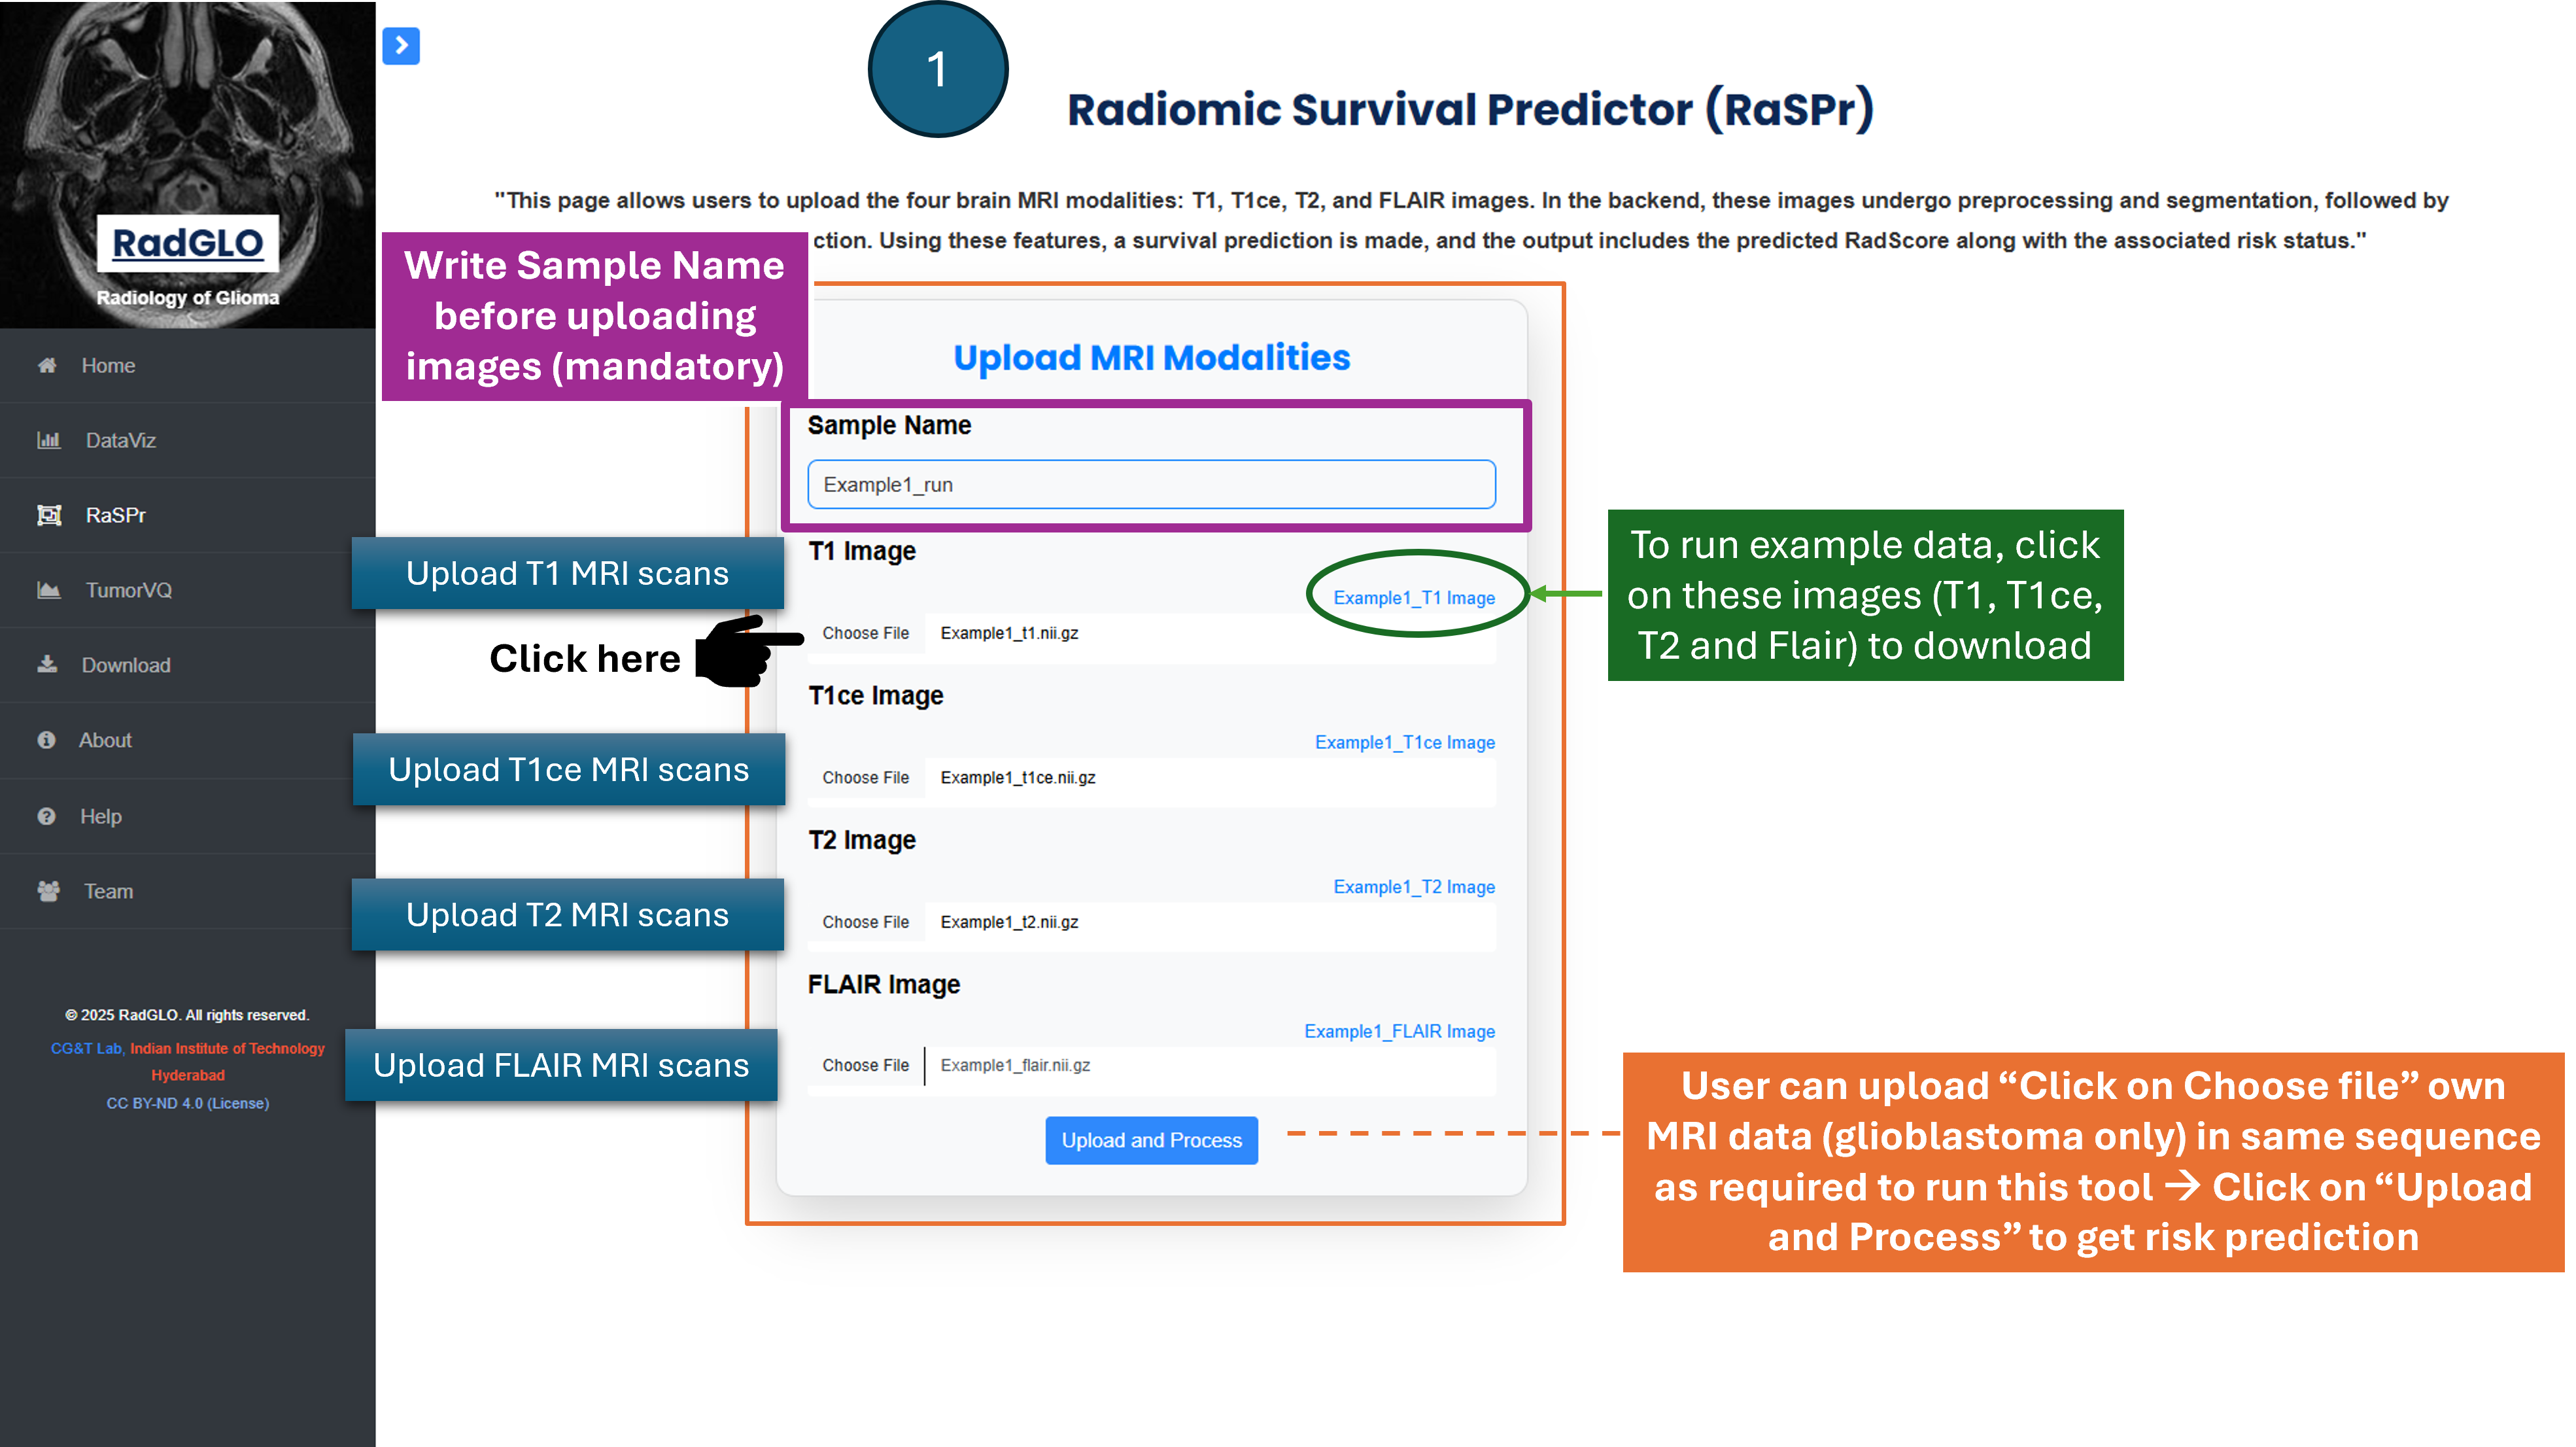
3.1 RaSPr Approach 1
RaSPr Approach 1: Users upload all raw modalities (T1, T1CE, T2, FLAIR) for complete processing.
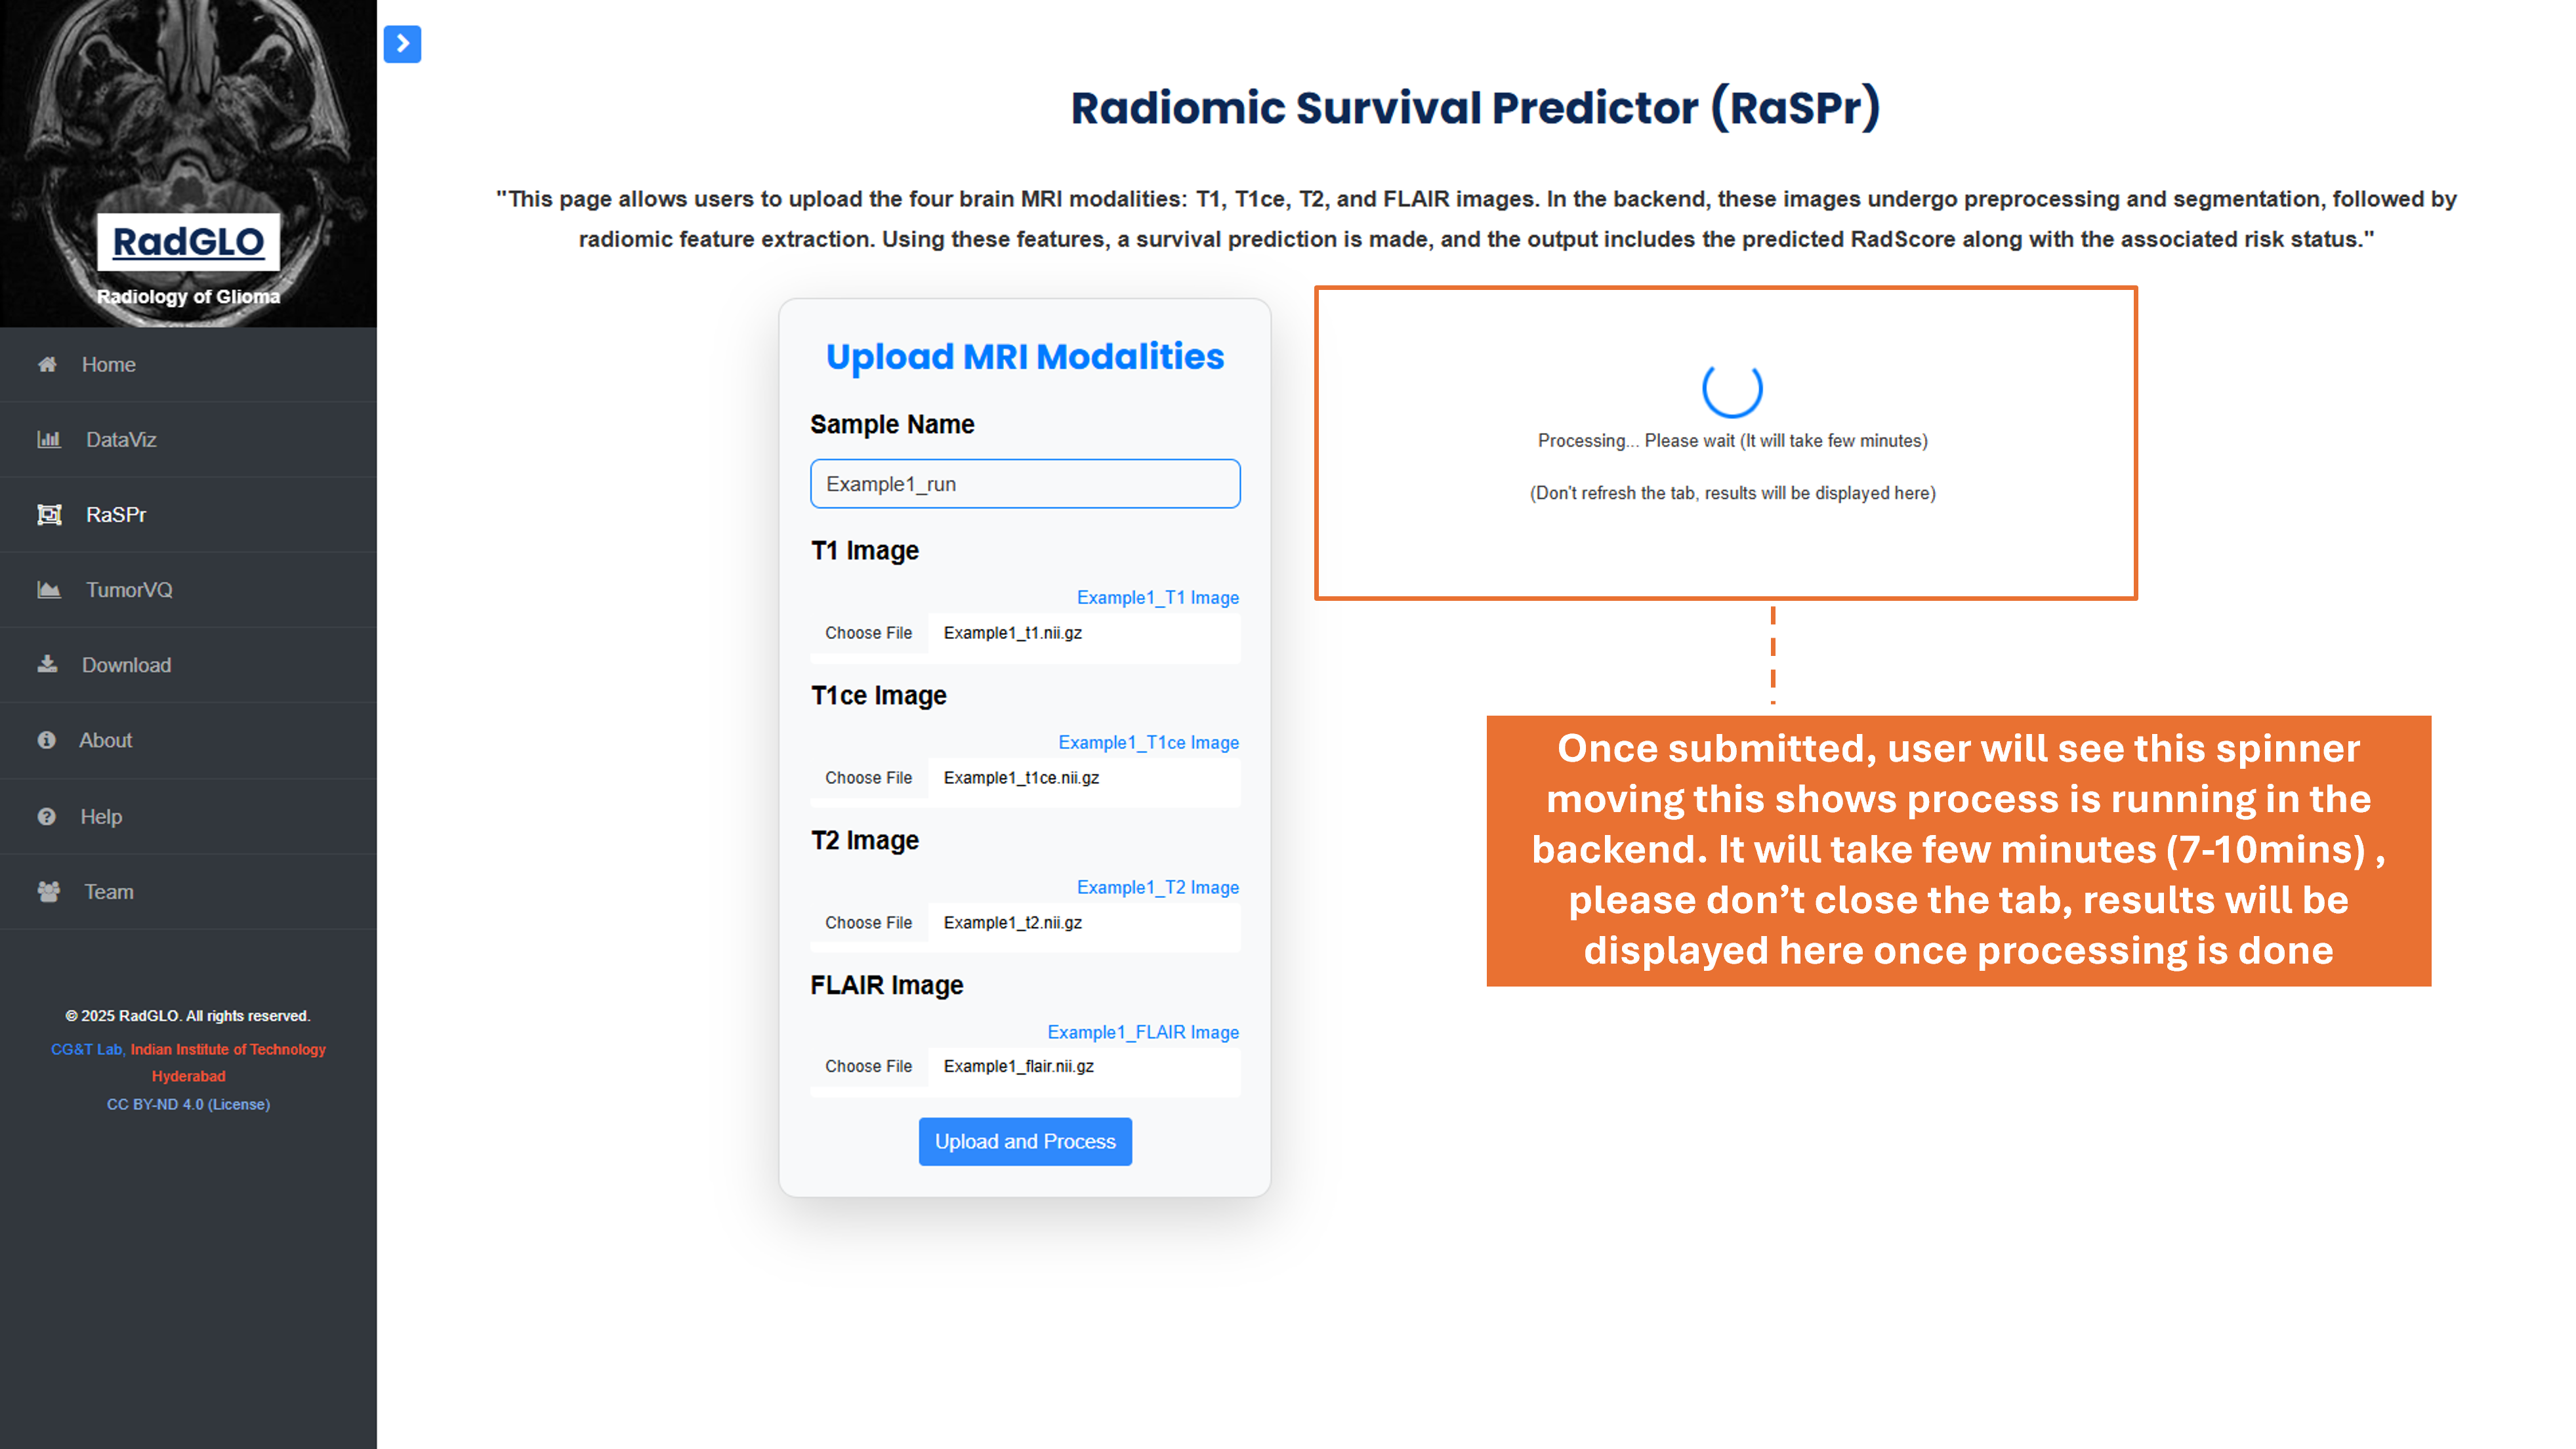
3.1 RaSPr Processing
RaSPr backend processes: includes preprocessing, segmentation, feature extraction, and RadScore calculation.
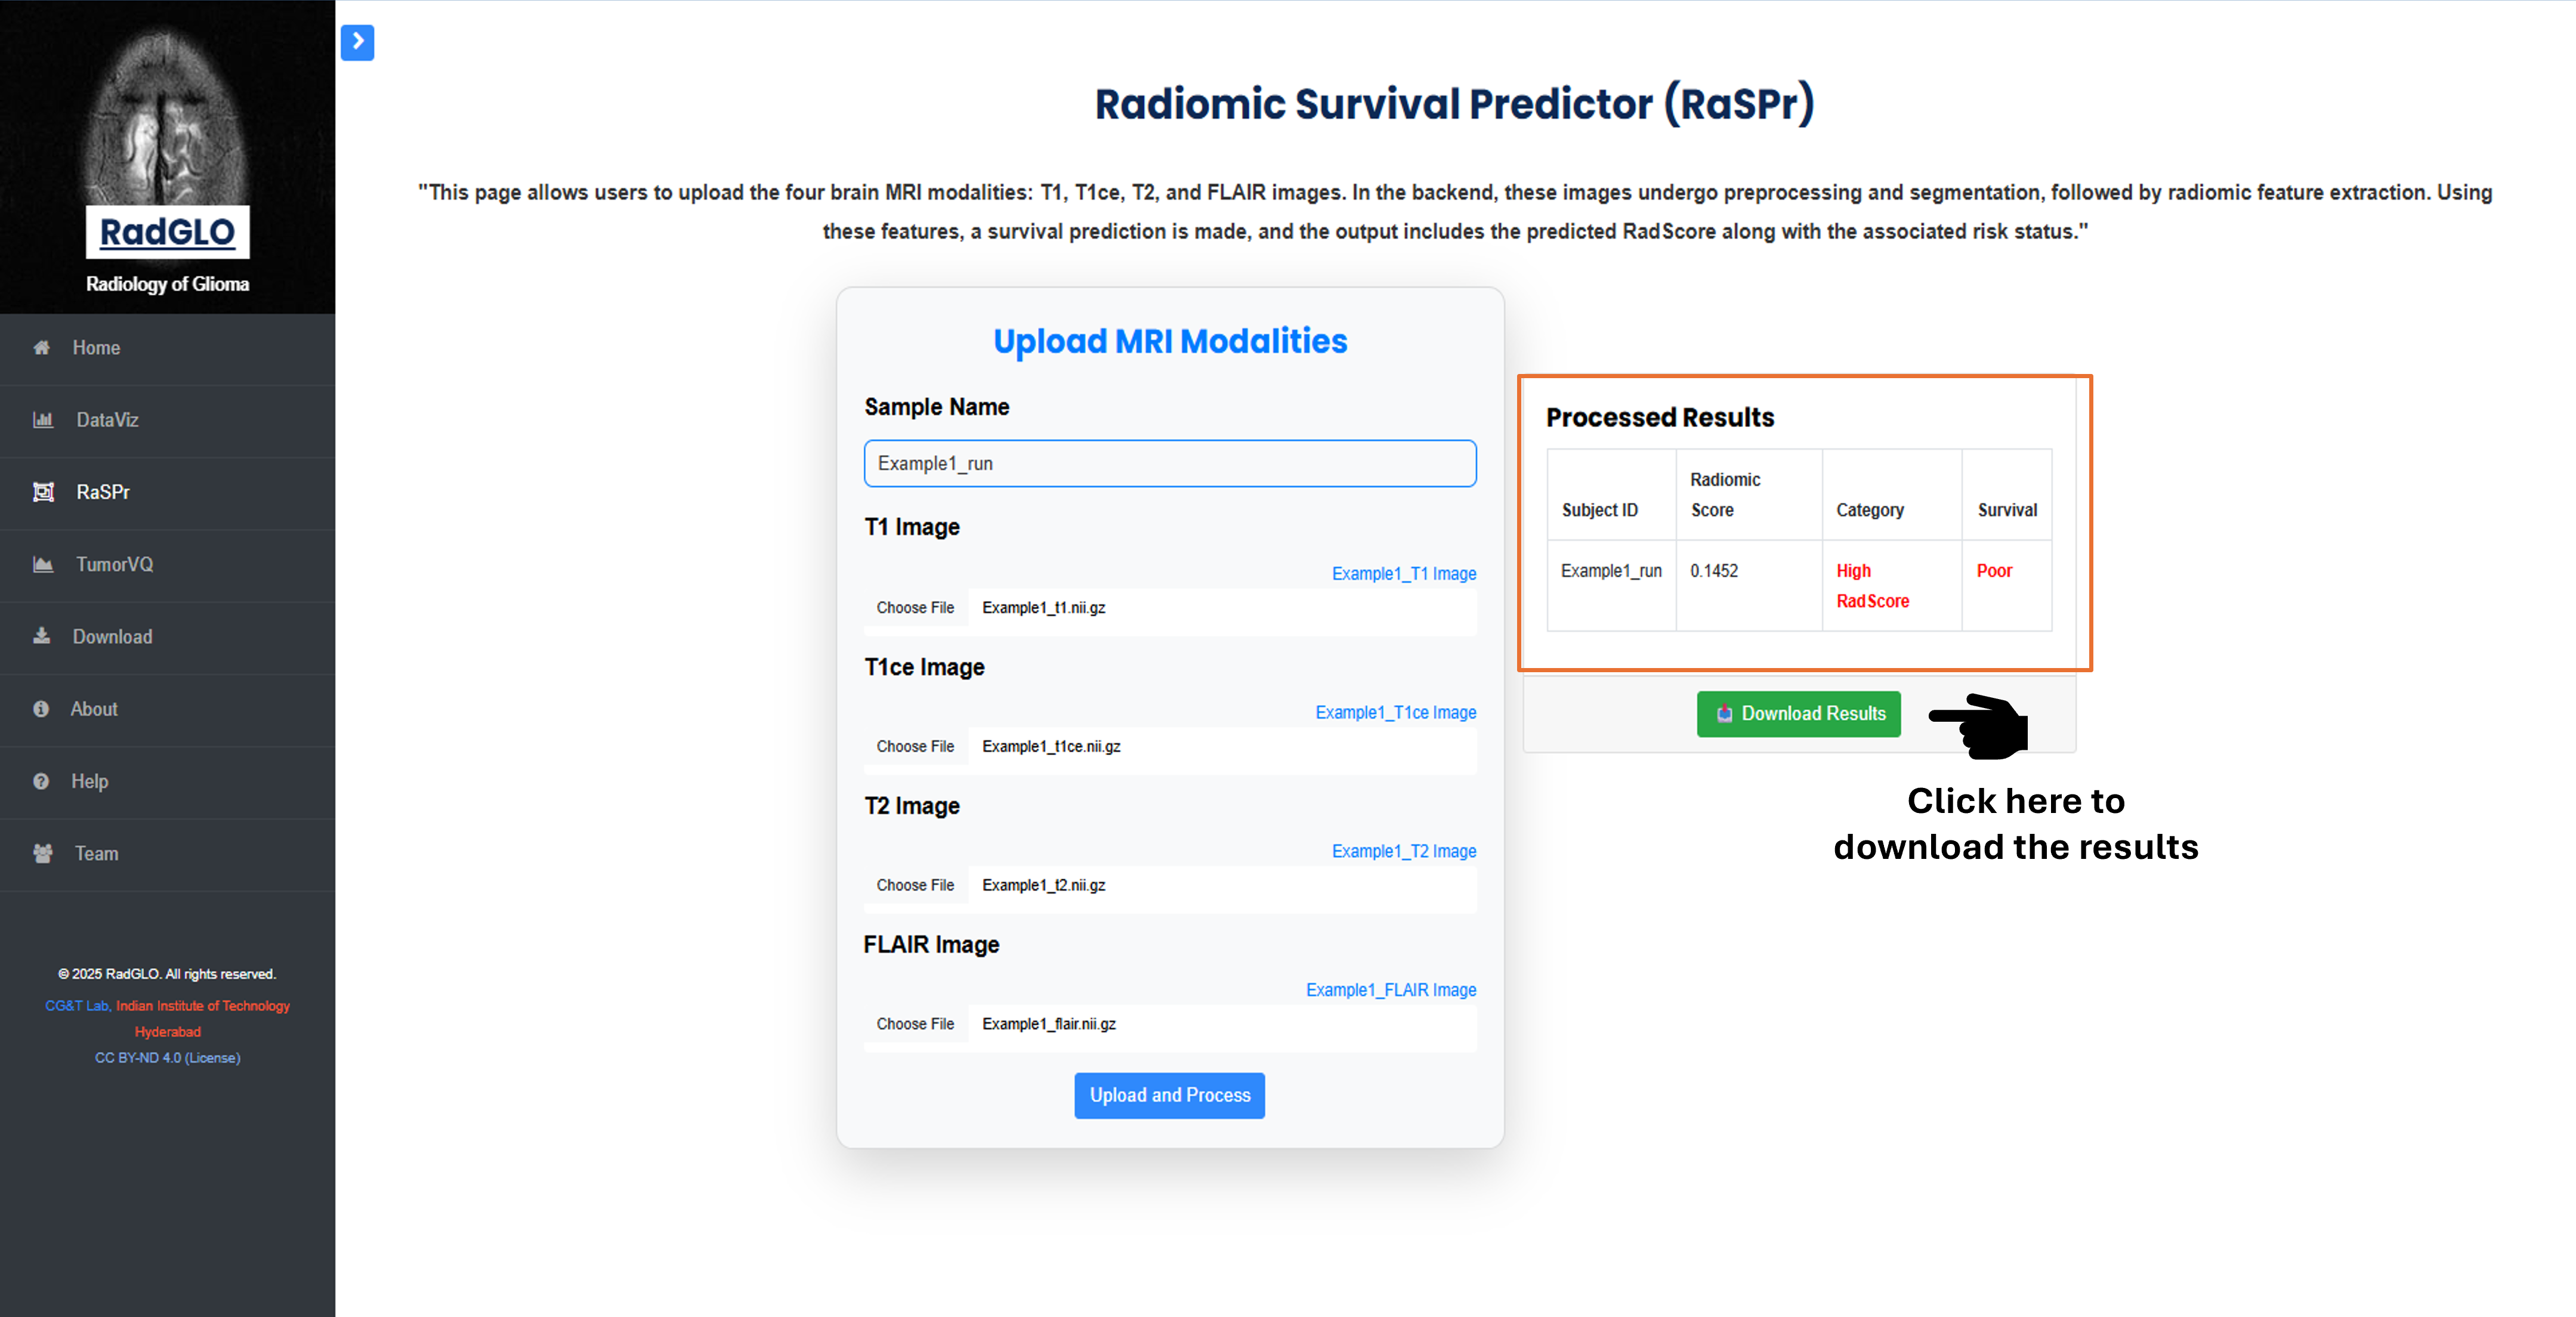
3.1 RaSPr Result
Output table displaying sample name, RadScore, predicted risk group, and survival outcome. Downloadable format.
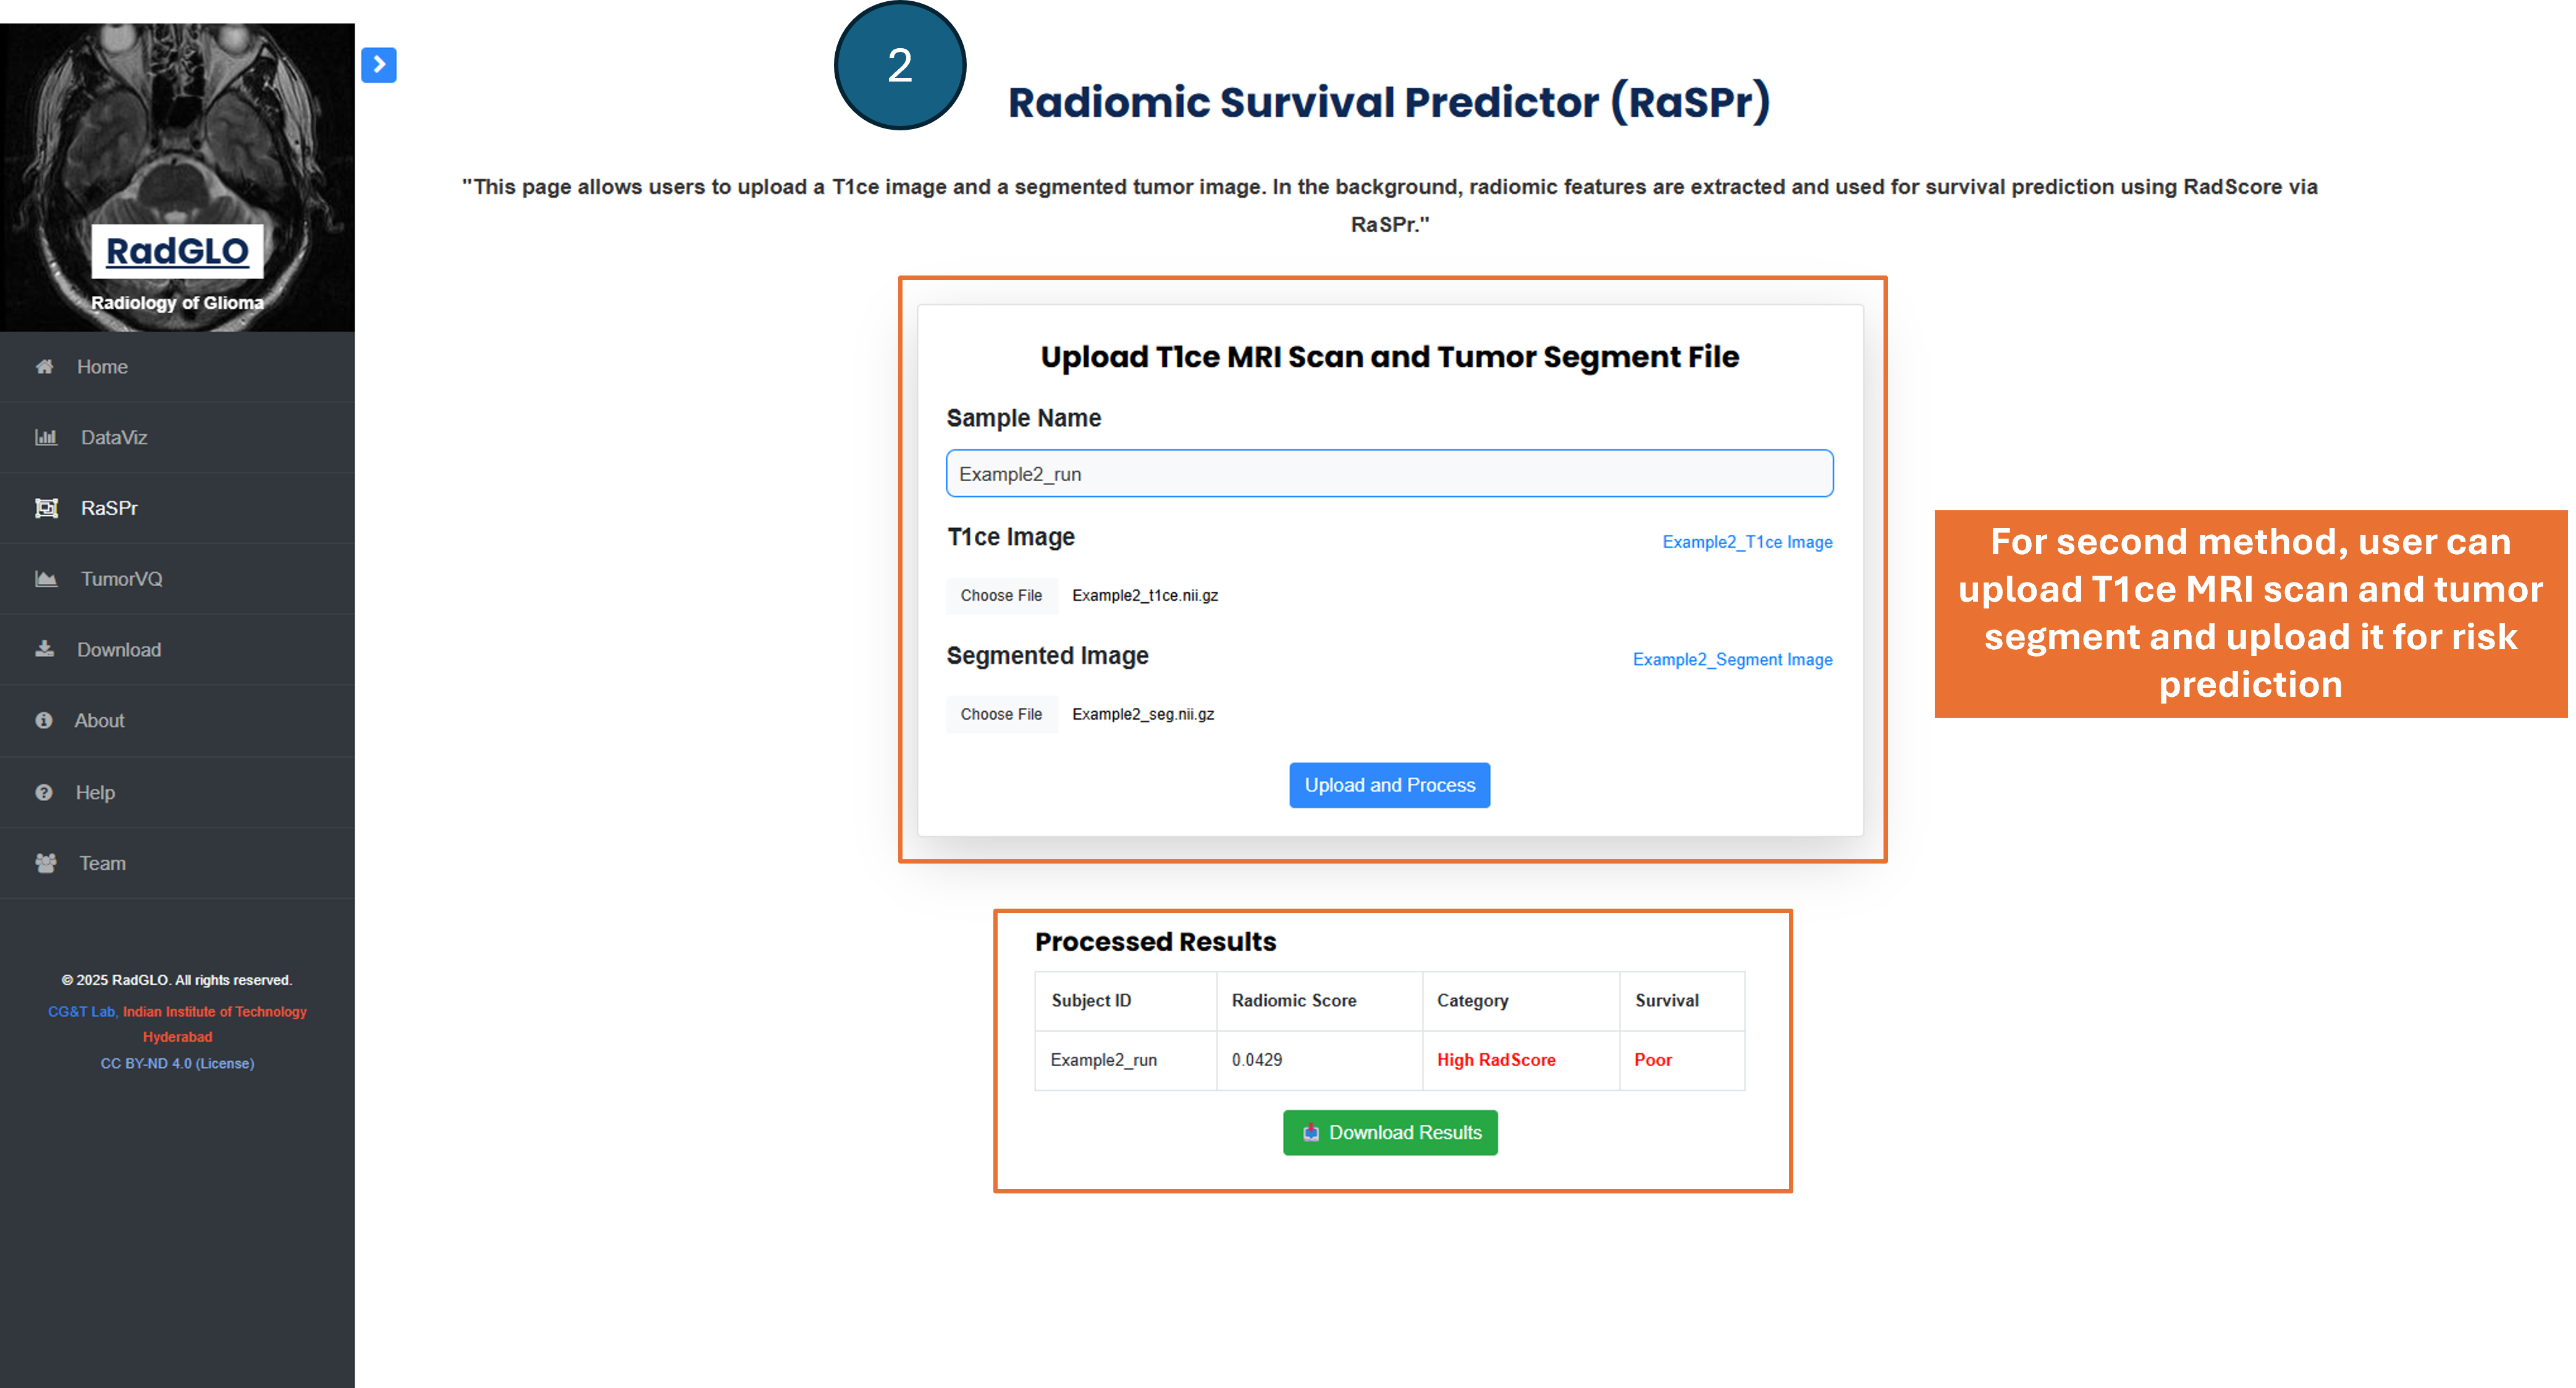
3.2 RaSPr Approach 2
RaSPr Approach 2: Users upload pre-segmented tumor and reference image to receive predicted risk table.
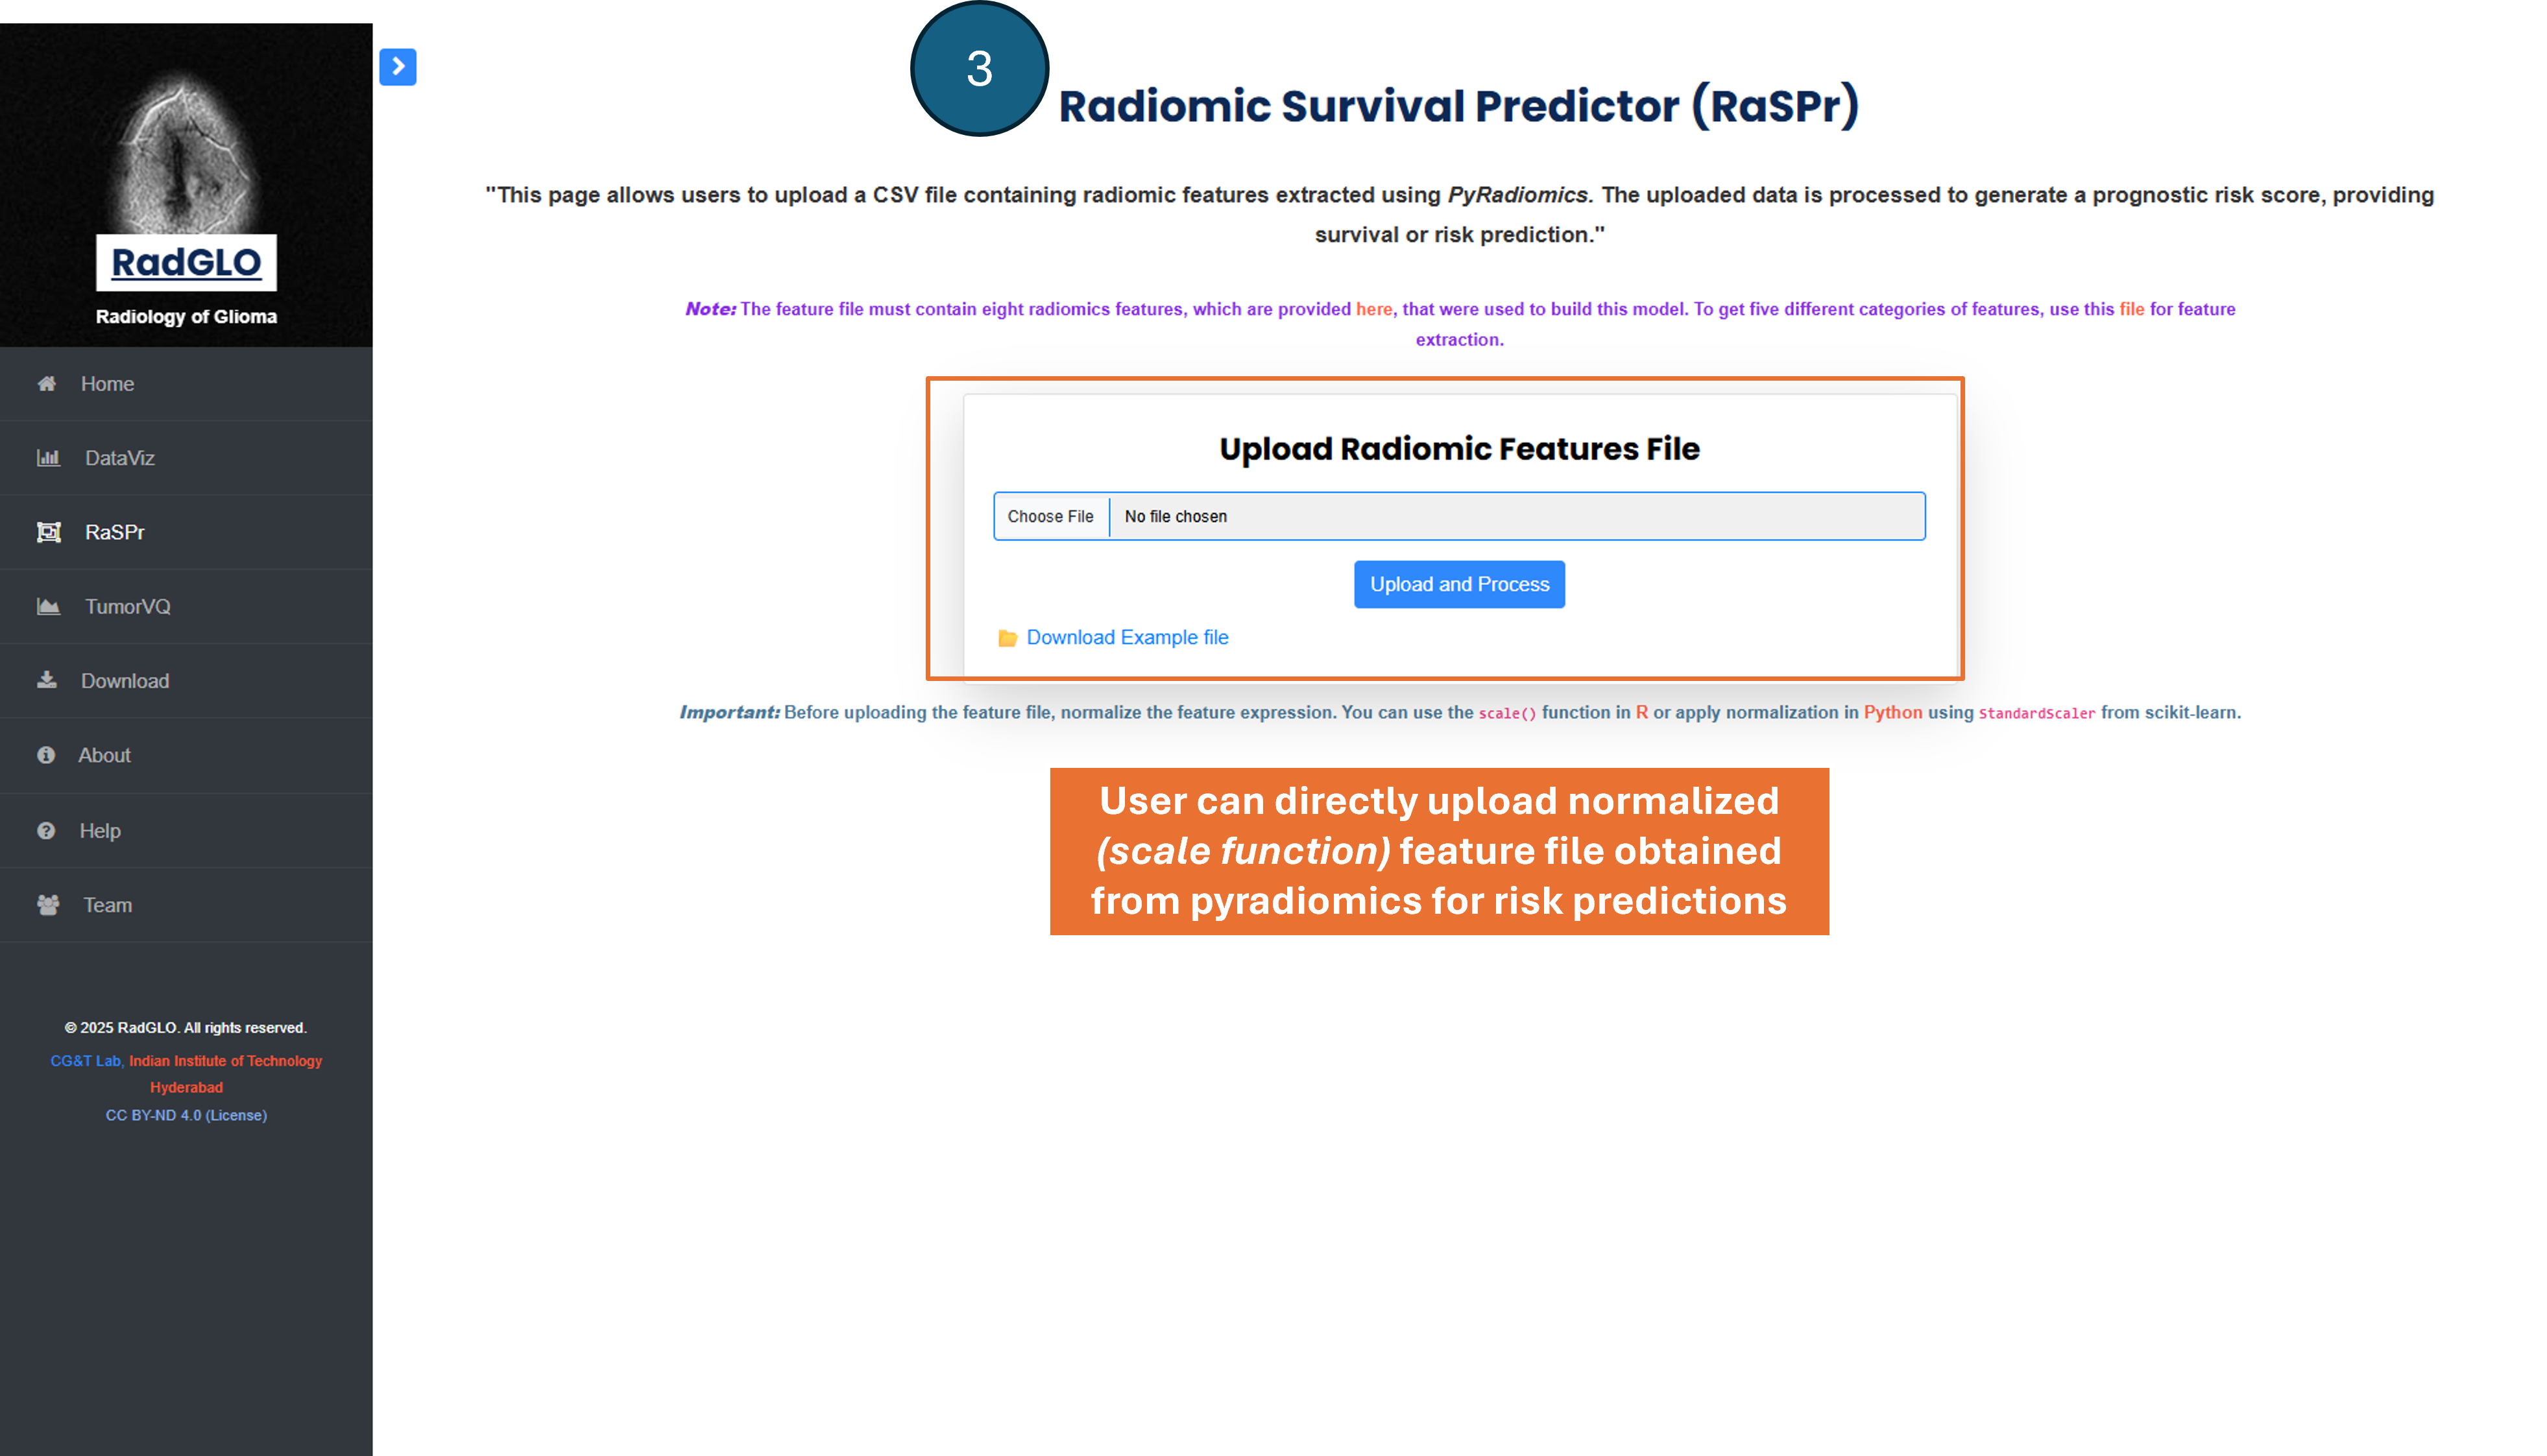
3.2 RaSPr Approach 3
RaSPr Approach 3: Users upload already extracted and normalized feature files (must be PyRadiomics-based).
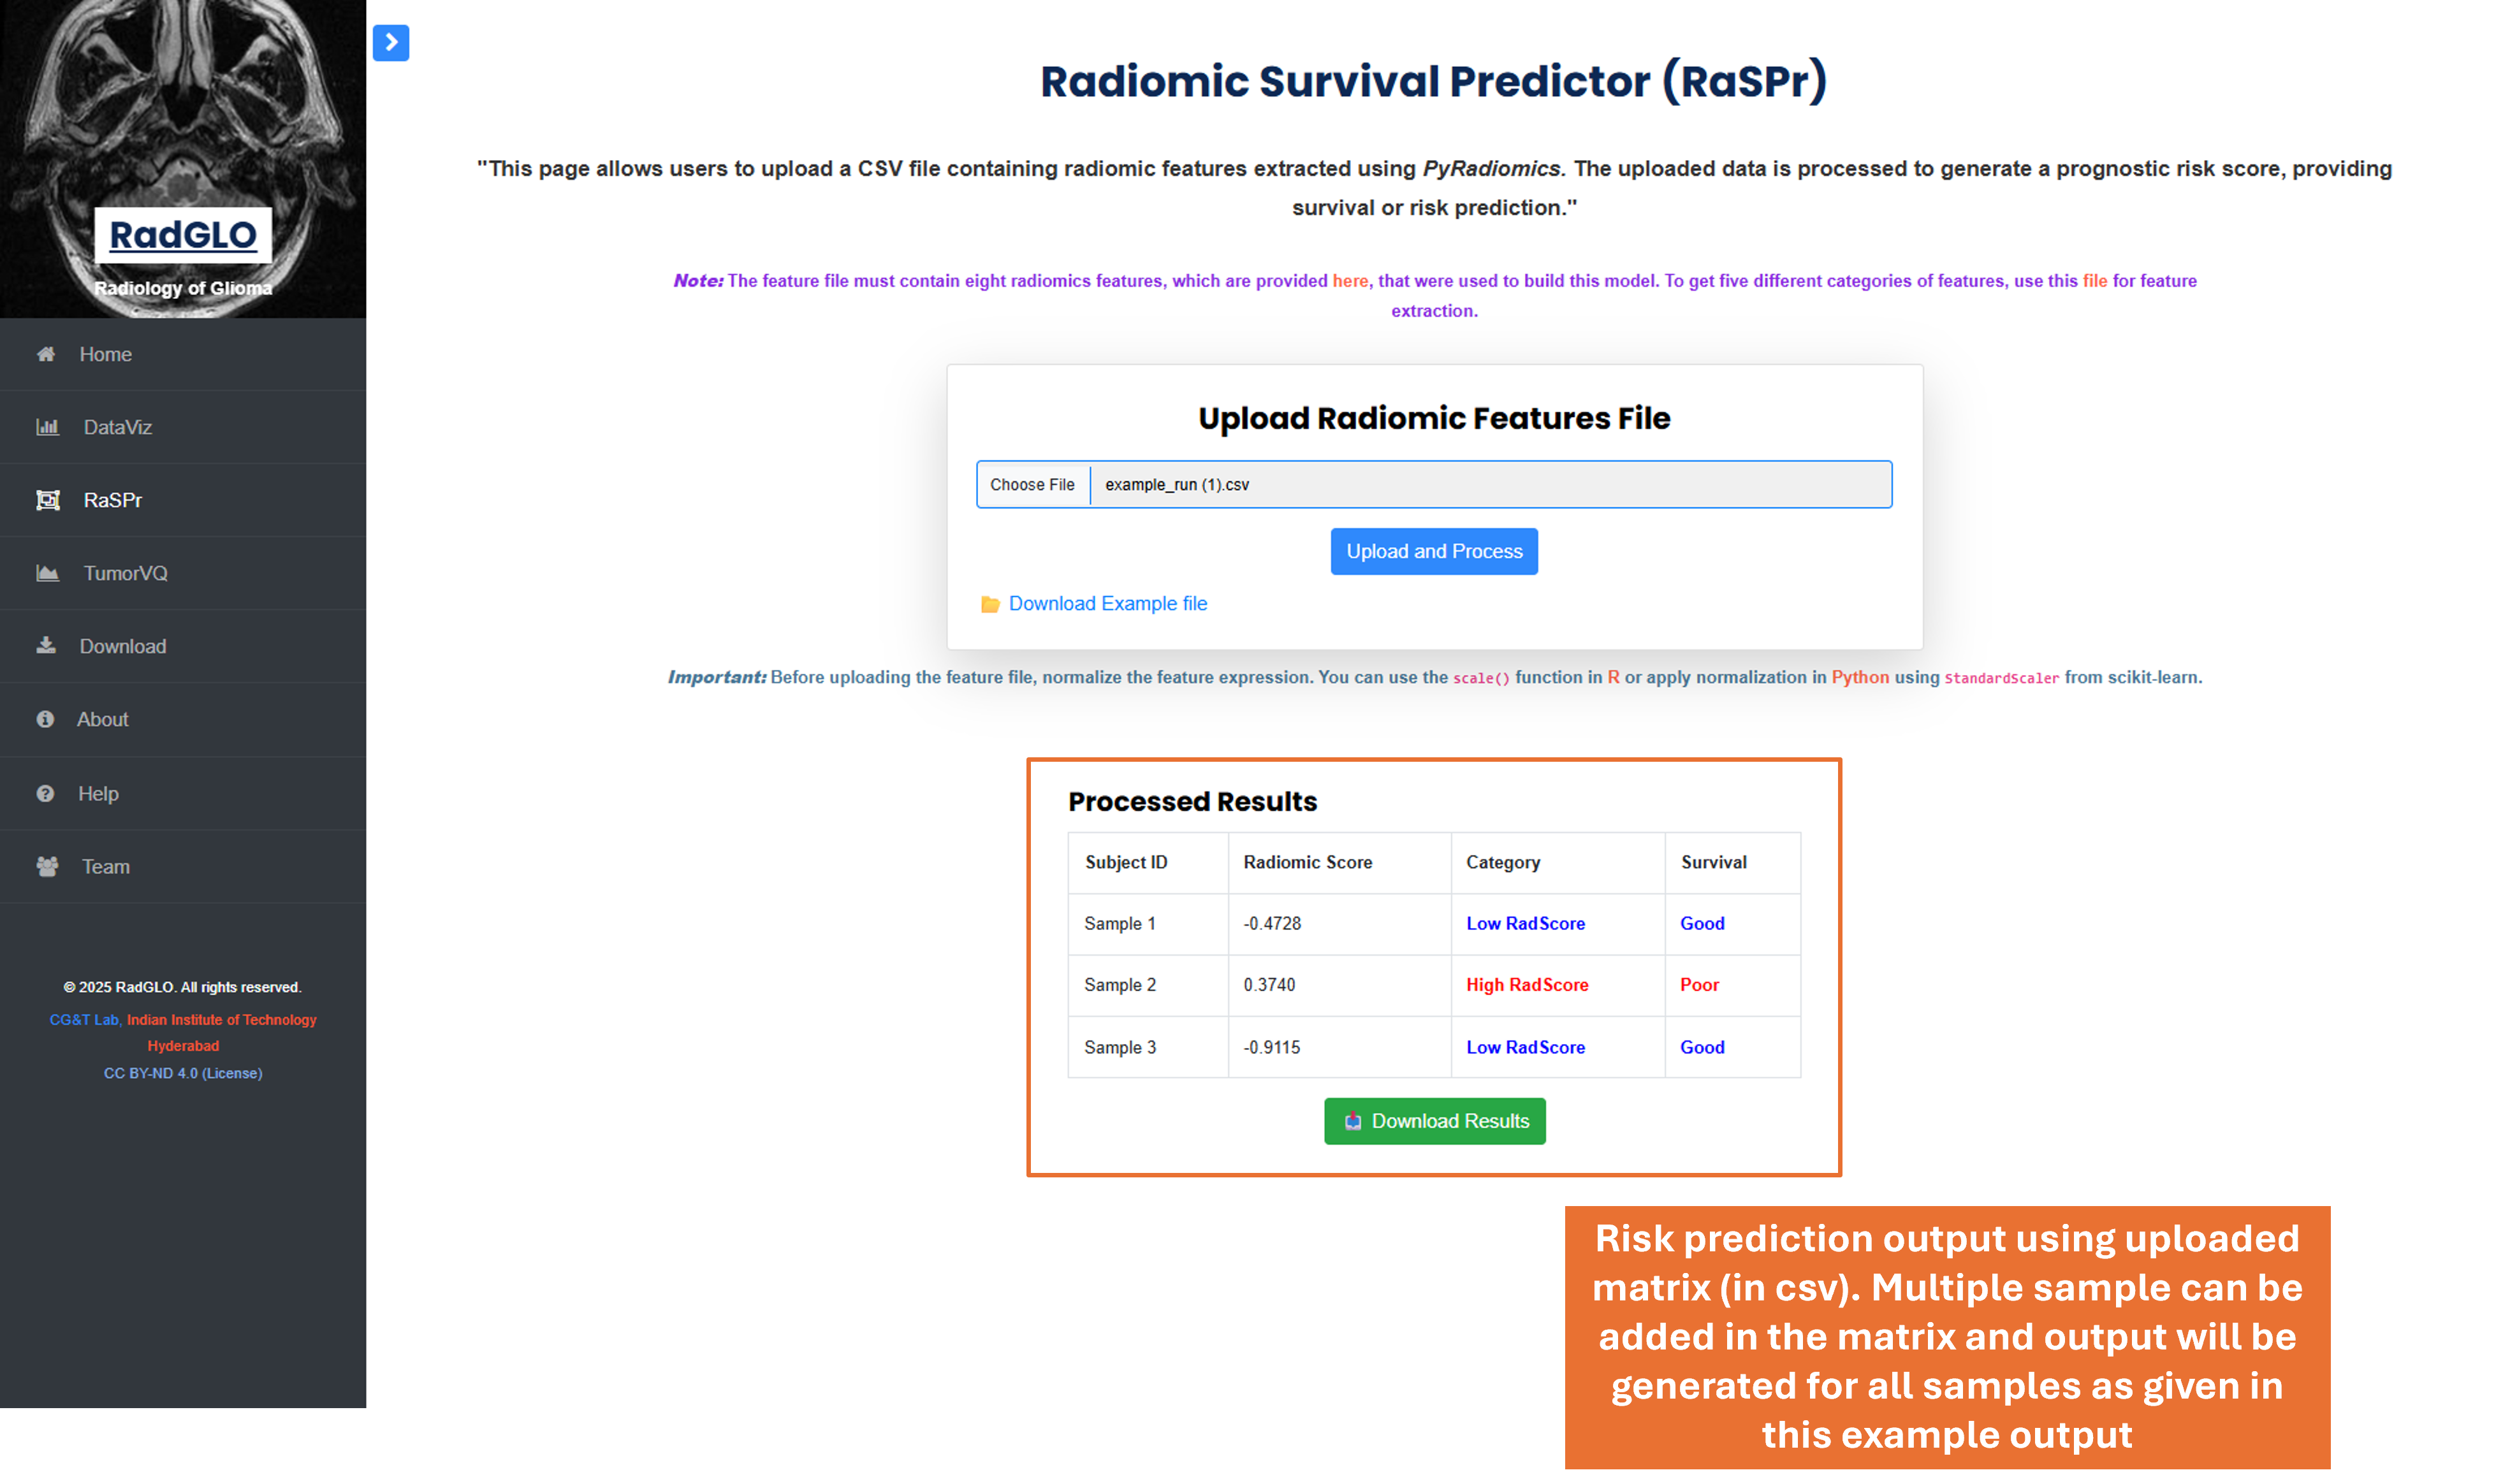
3.3 RaSPr Approach 3 Results
Tabular risk predictions for multiple samples using Approach 3 input. Bulk prediction supported.
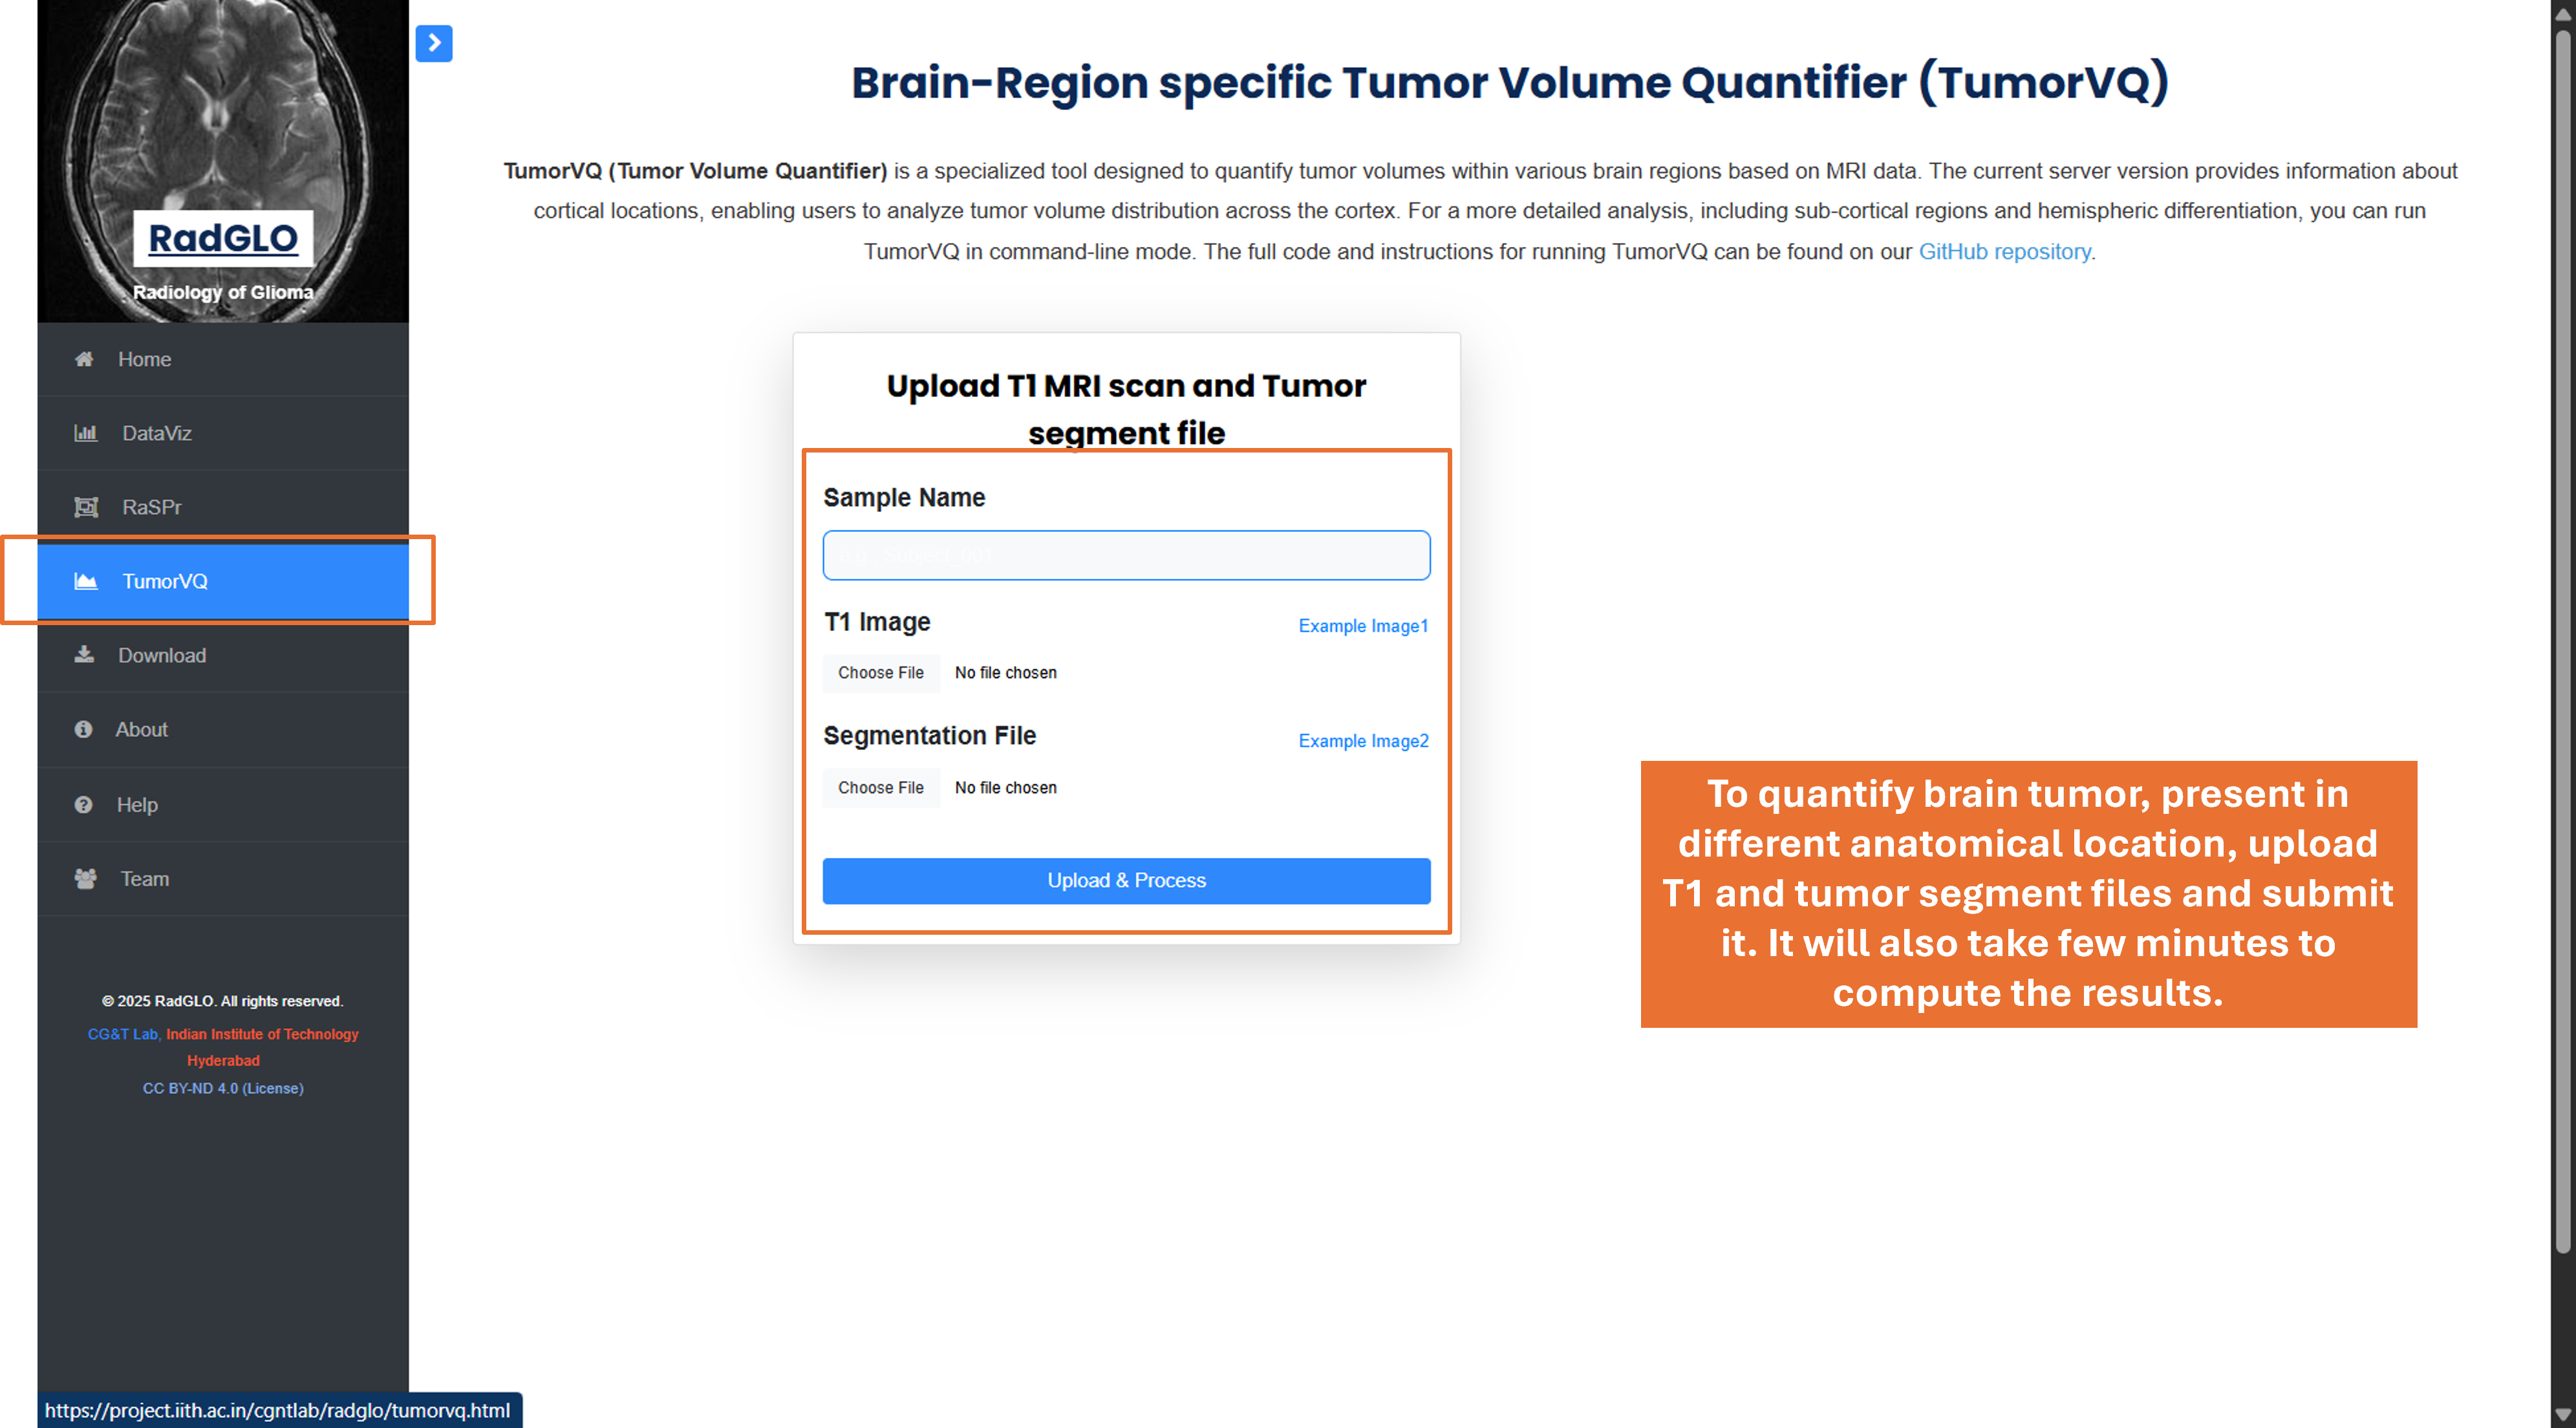
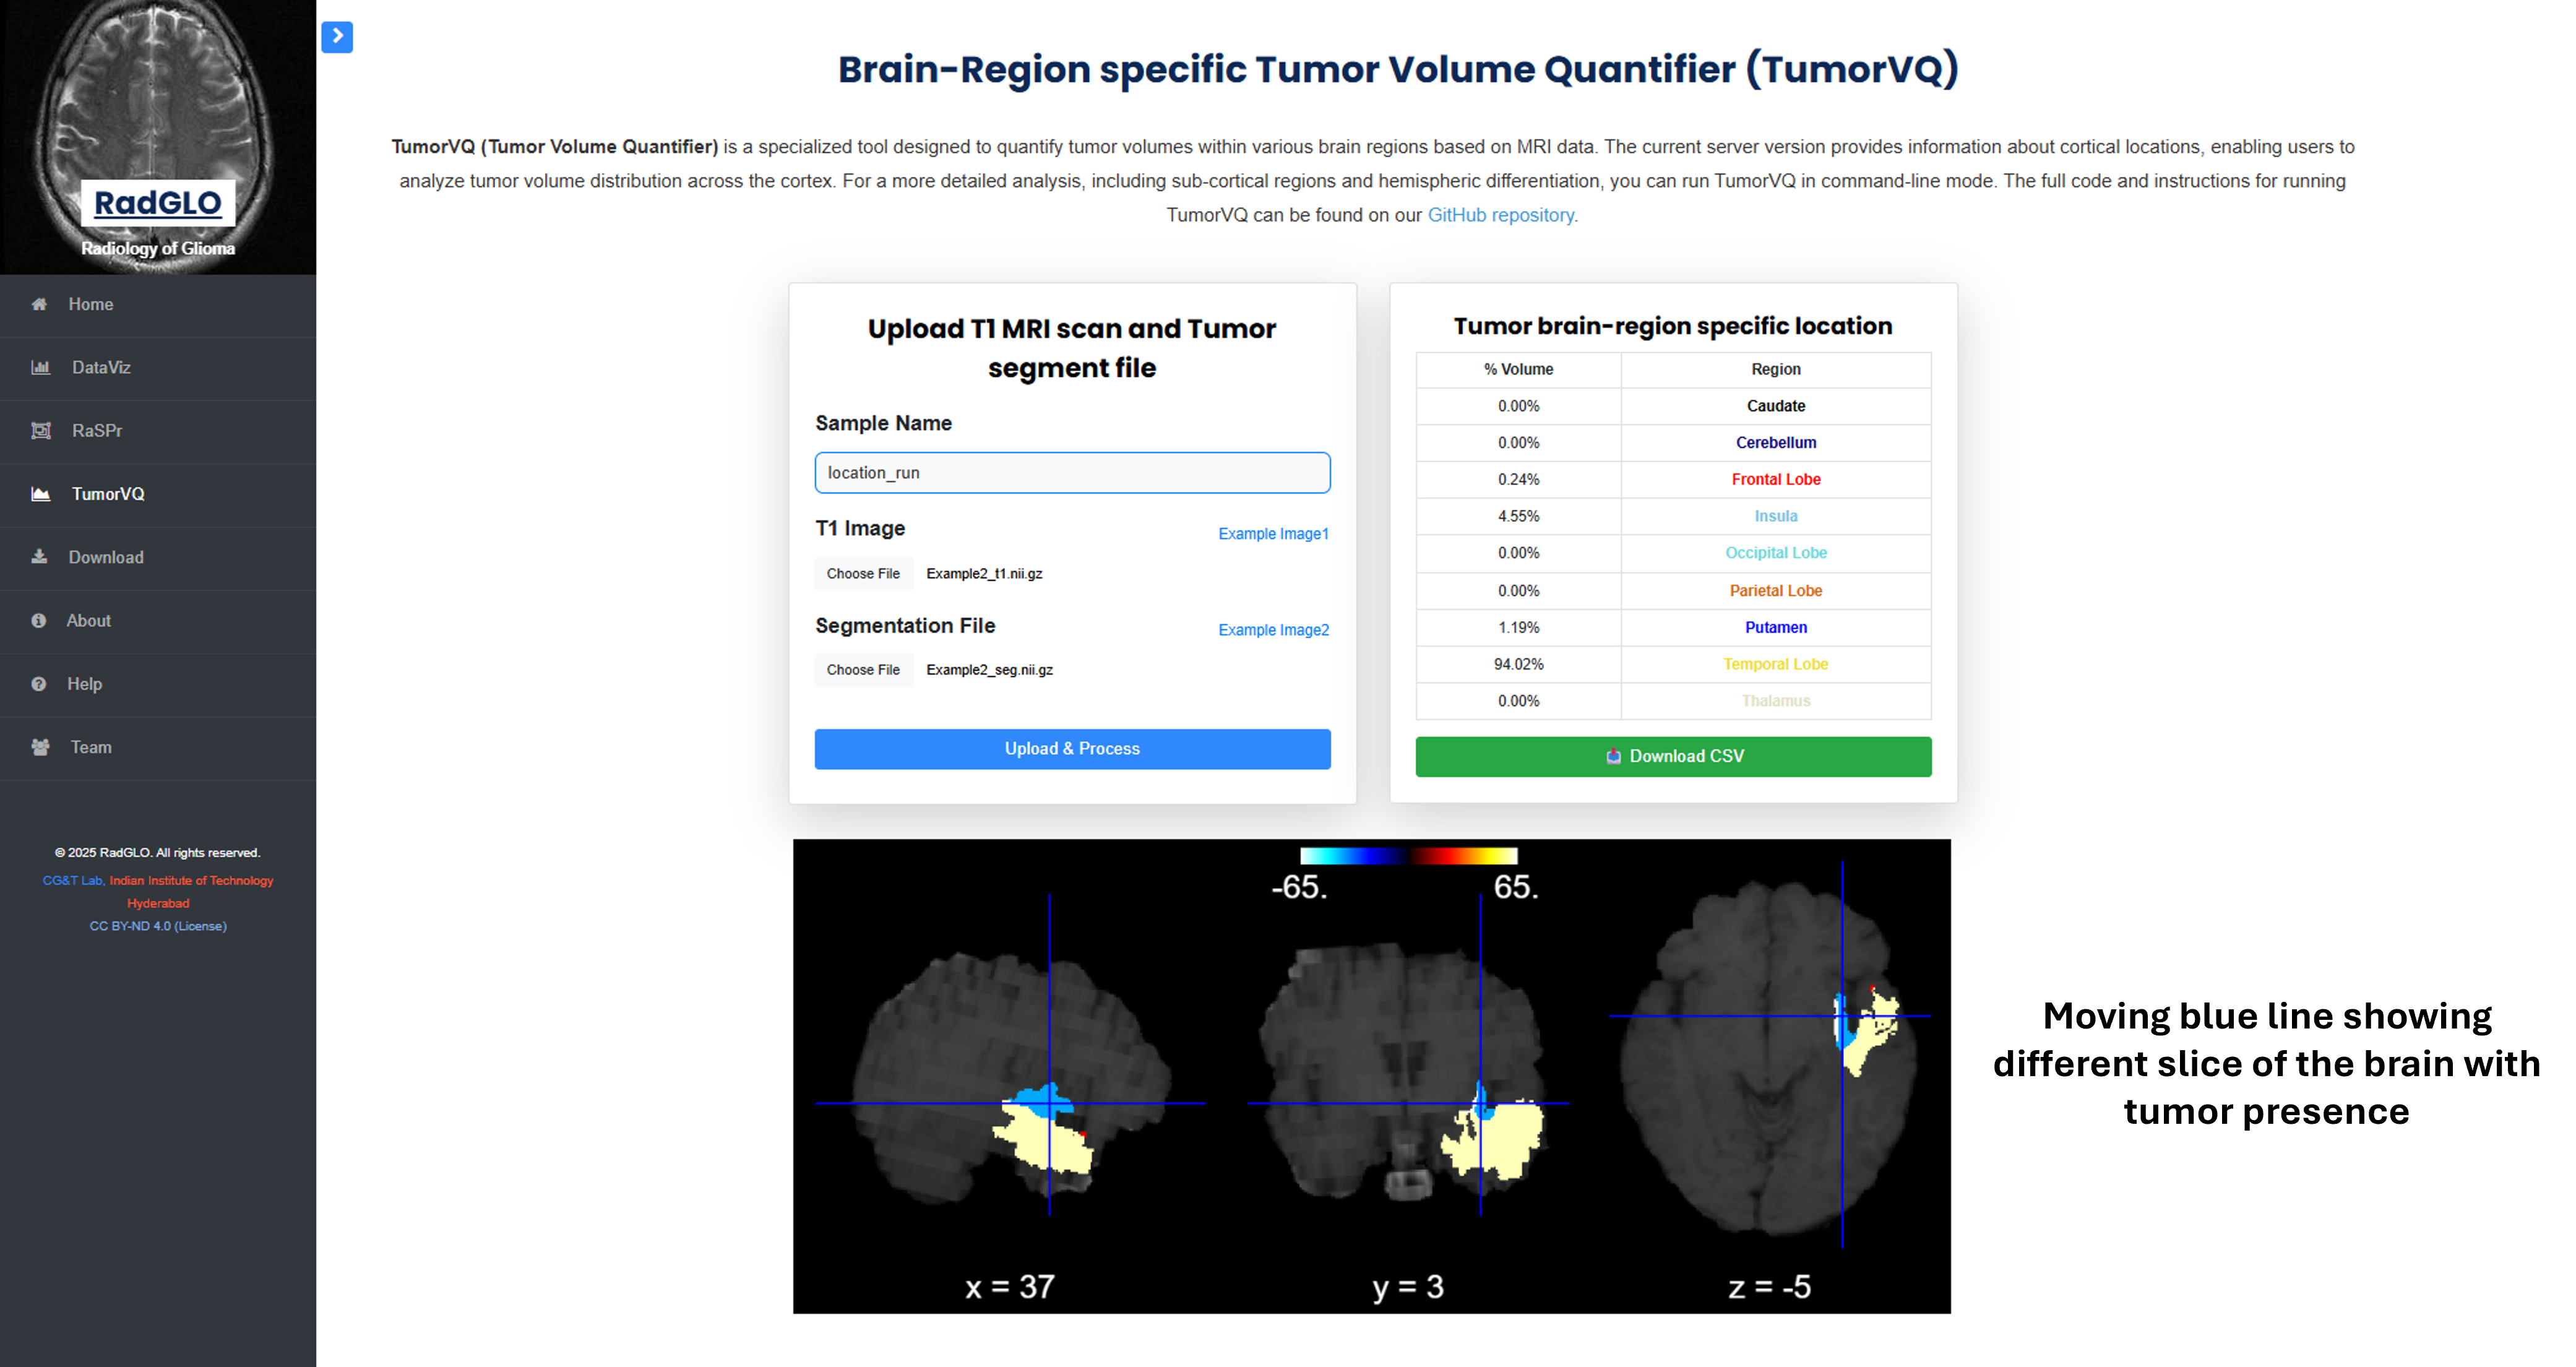
4. Tumor Volume Quantifier (TumorVQ)
TumorVQ: Developed for brain-region-specific tumor volume estimation. Requires reference T1 and segmented image.
4 TumorVQ Results
Tabular output showing tumor volume percentages across MNI cortical regions. Includes interactive visual plots.
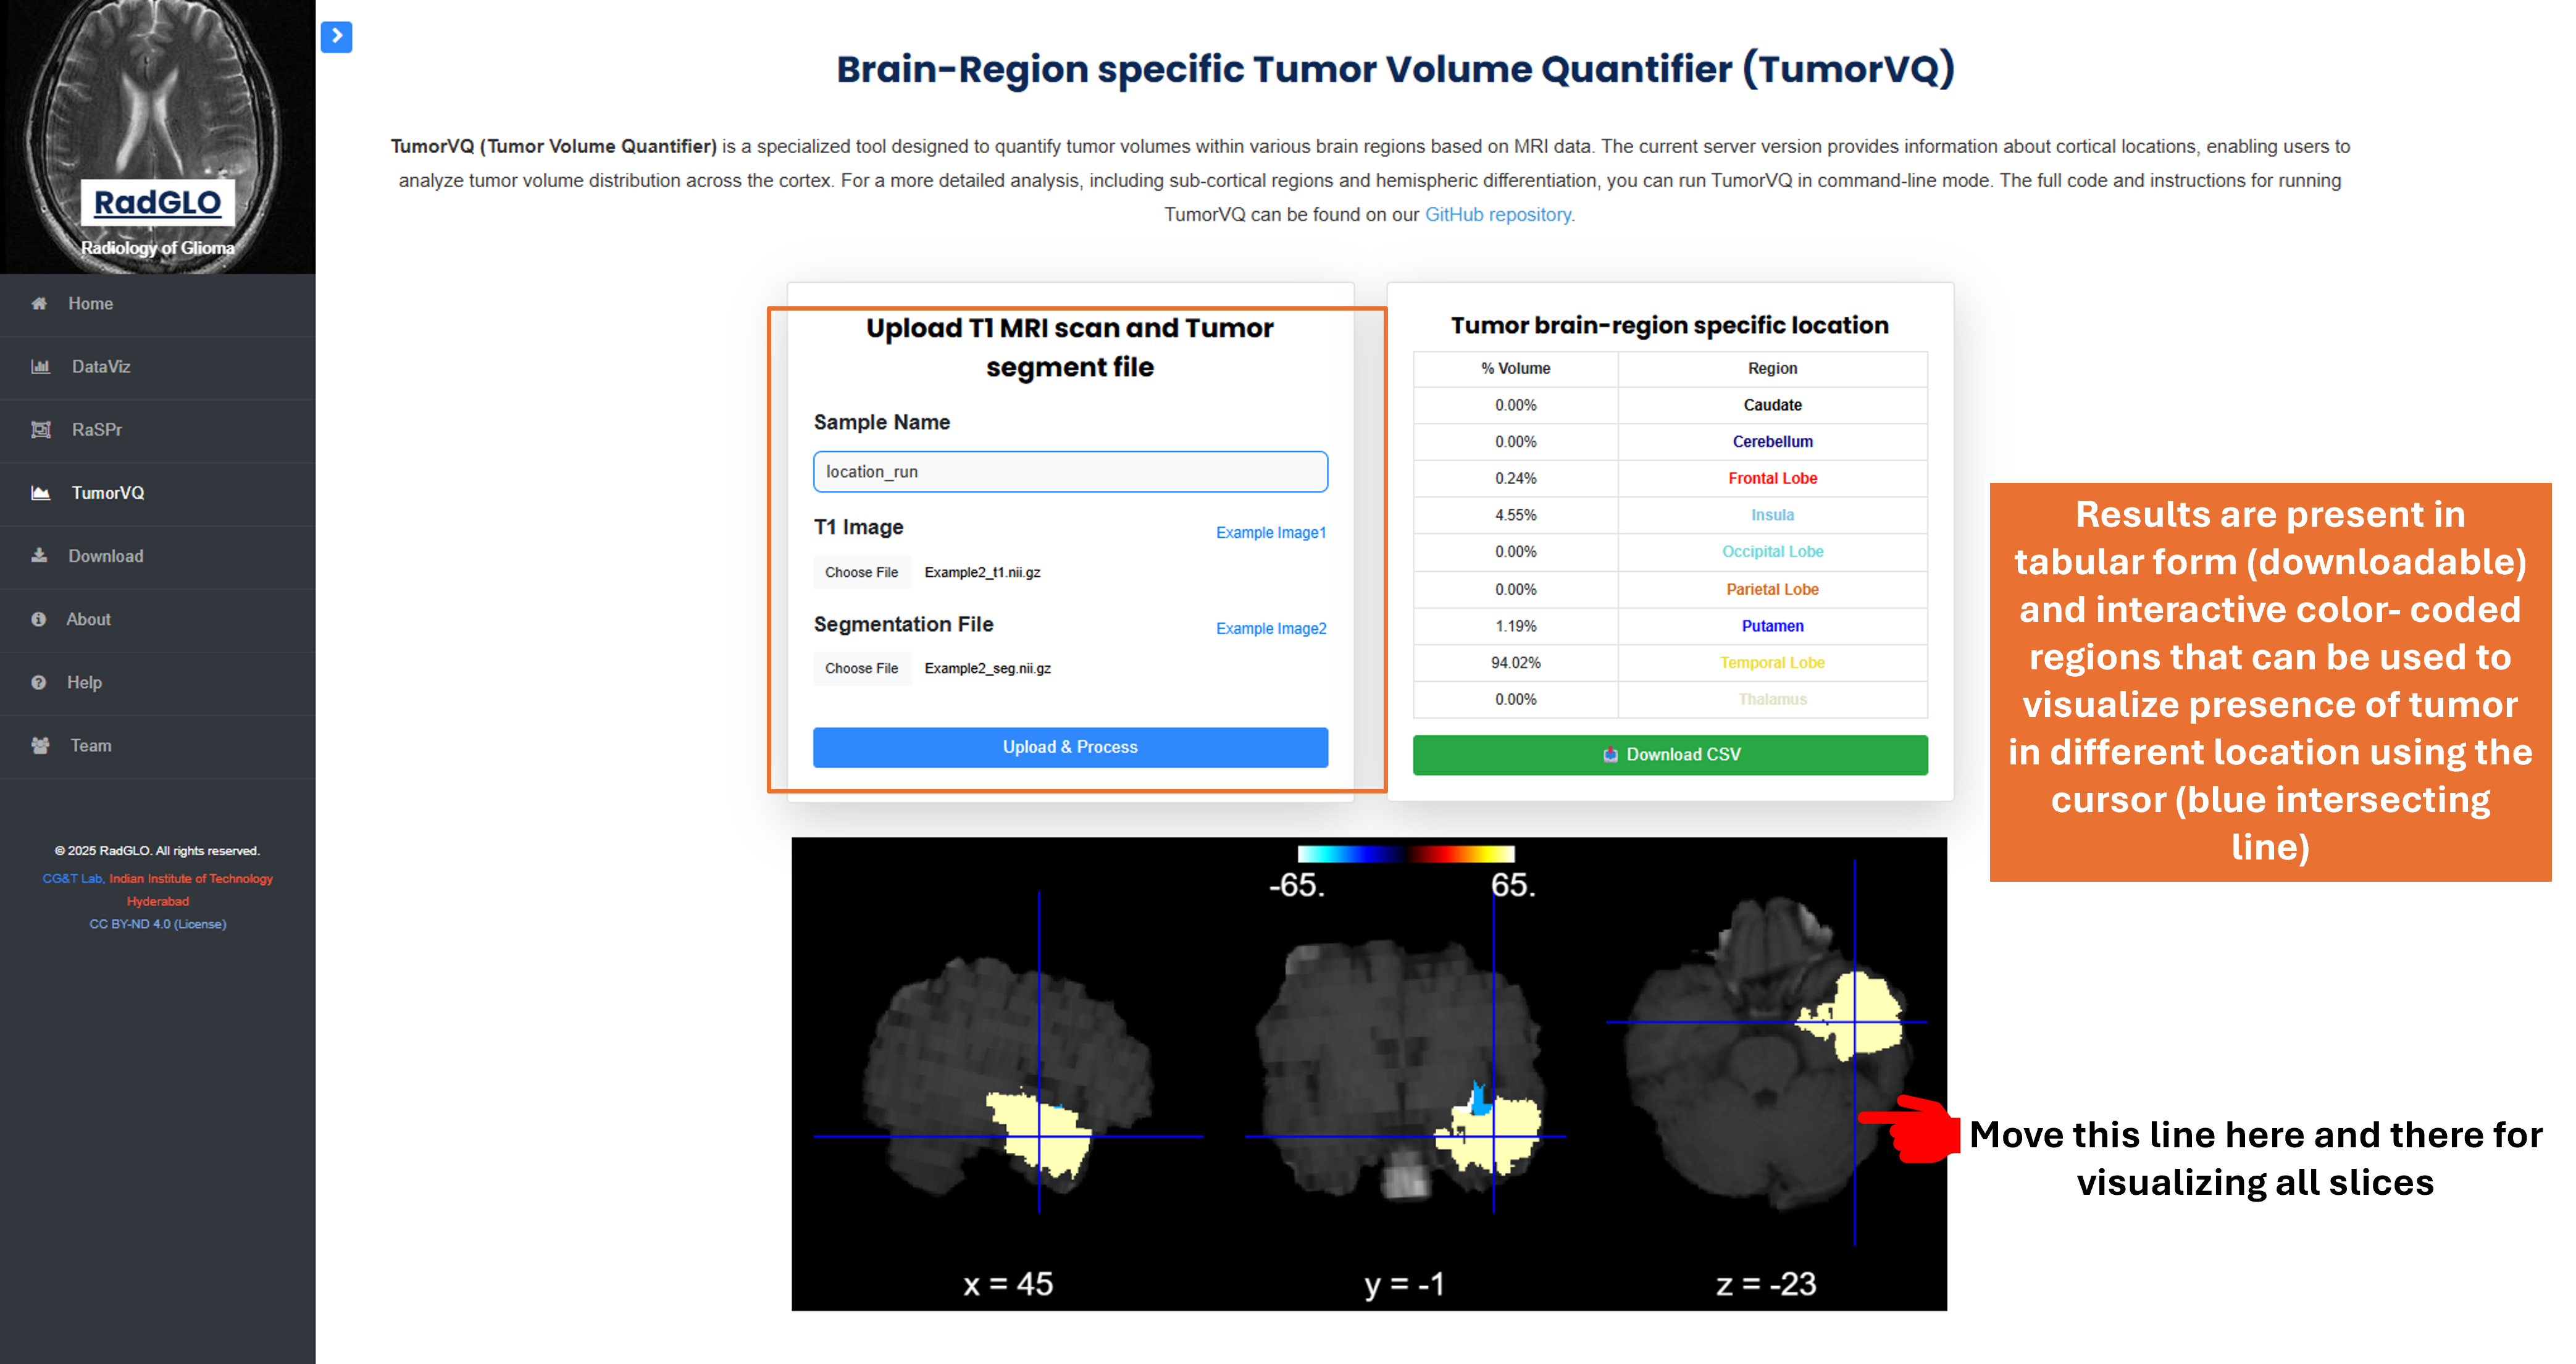
4 TumorVQ Results
Interactive tumor map with a movable blue line to explore tumor volume across brain regions in detail.
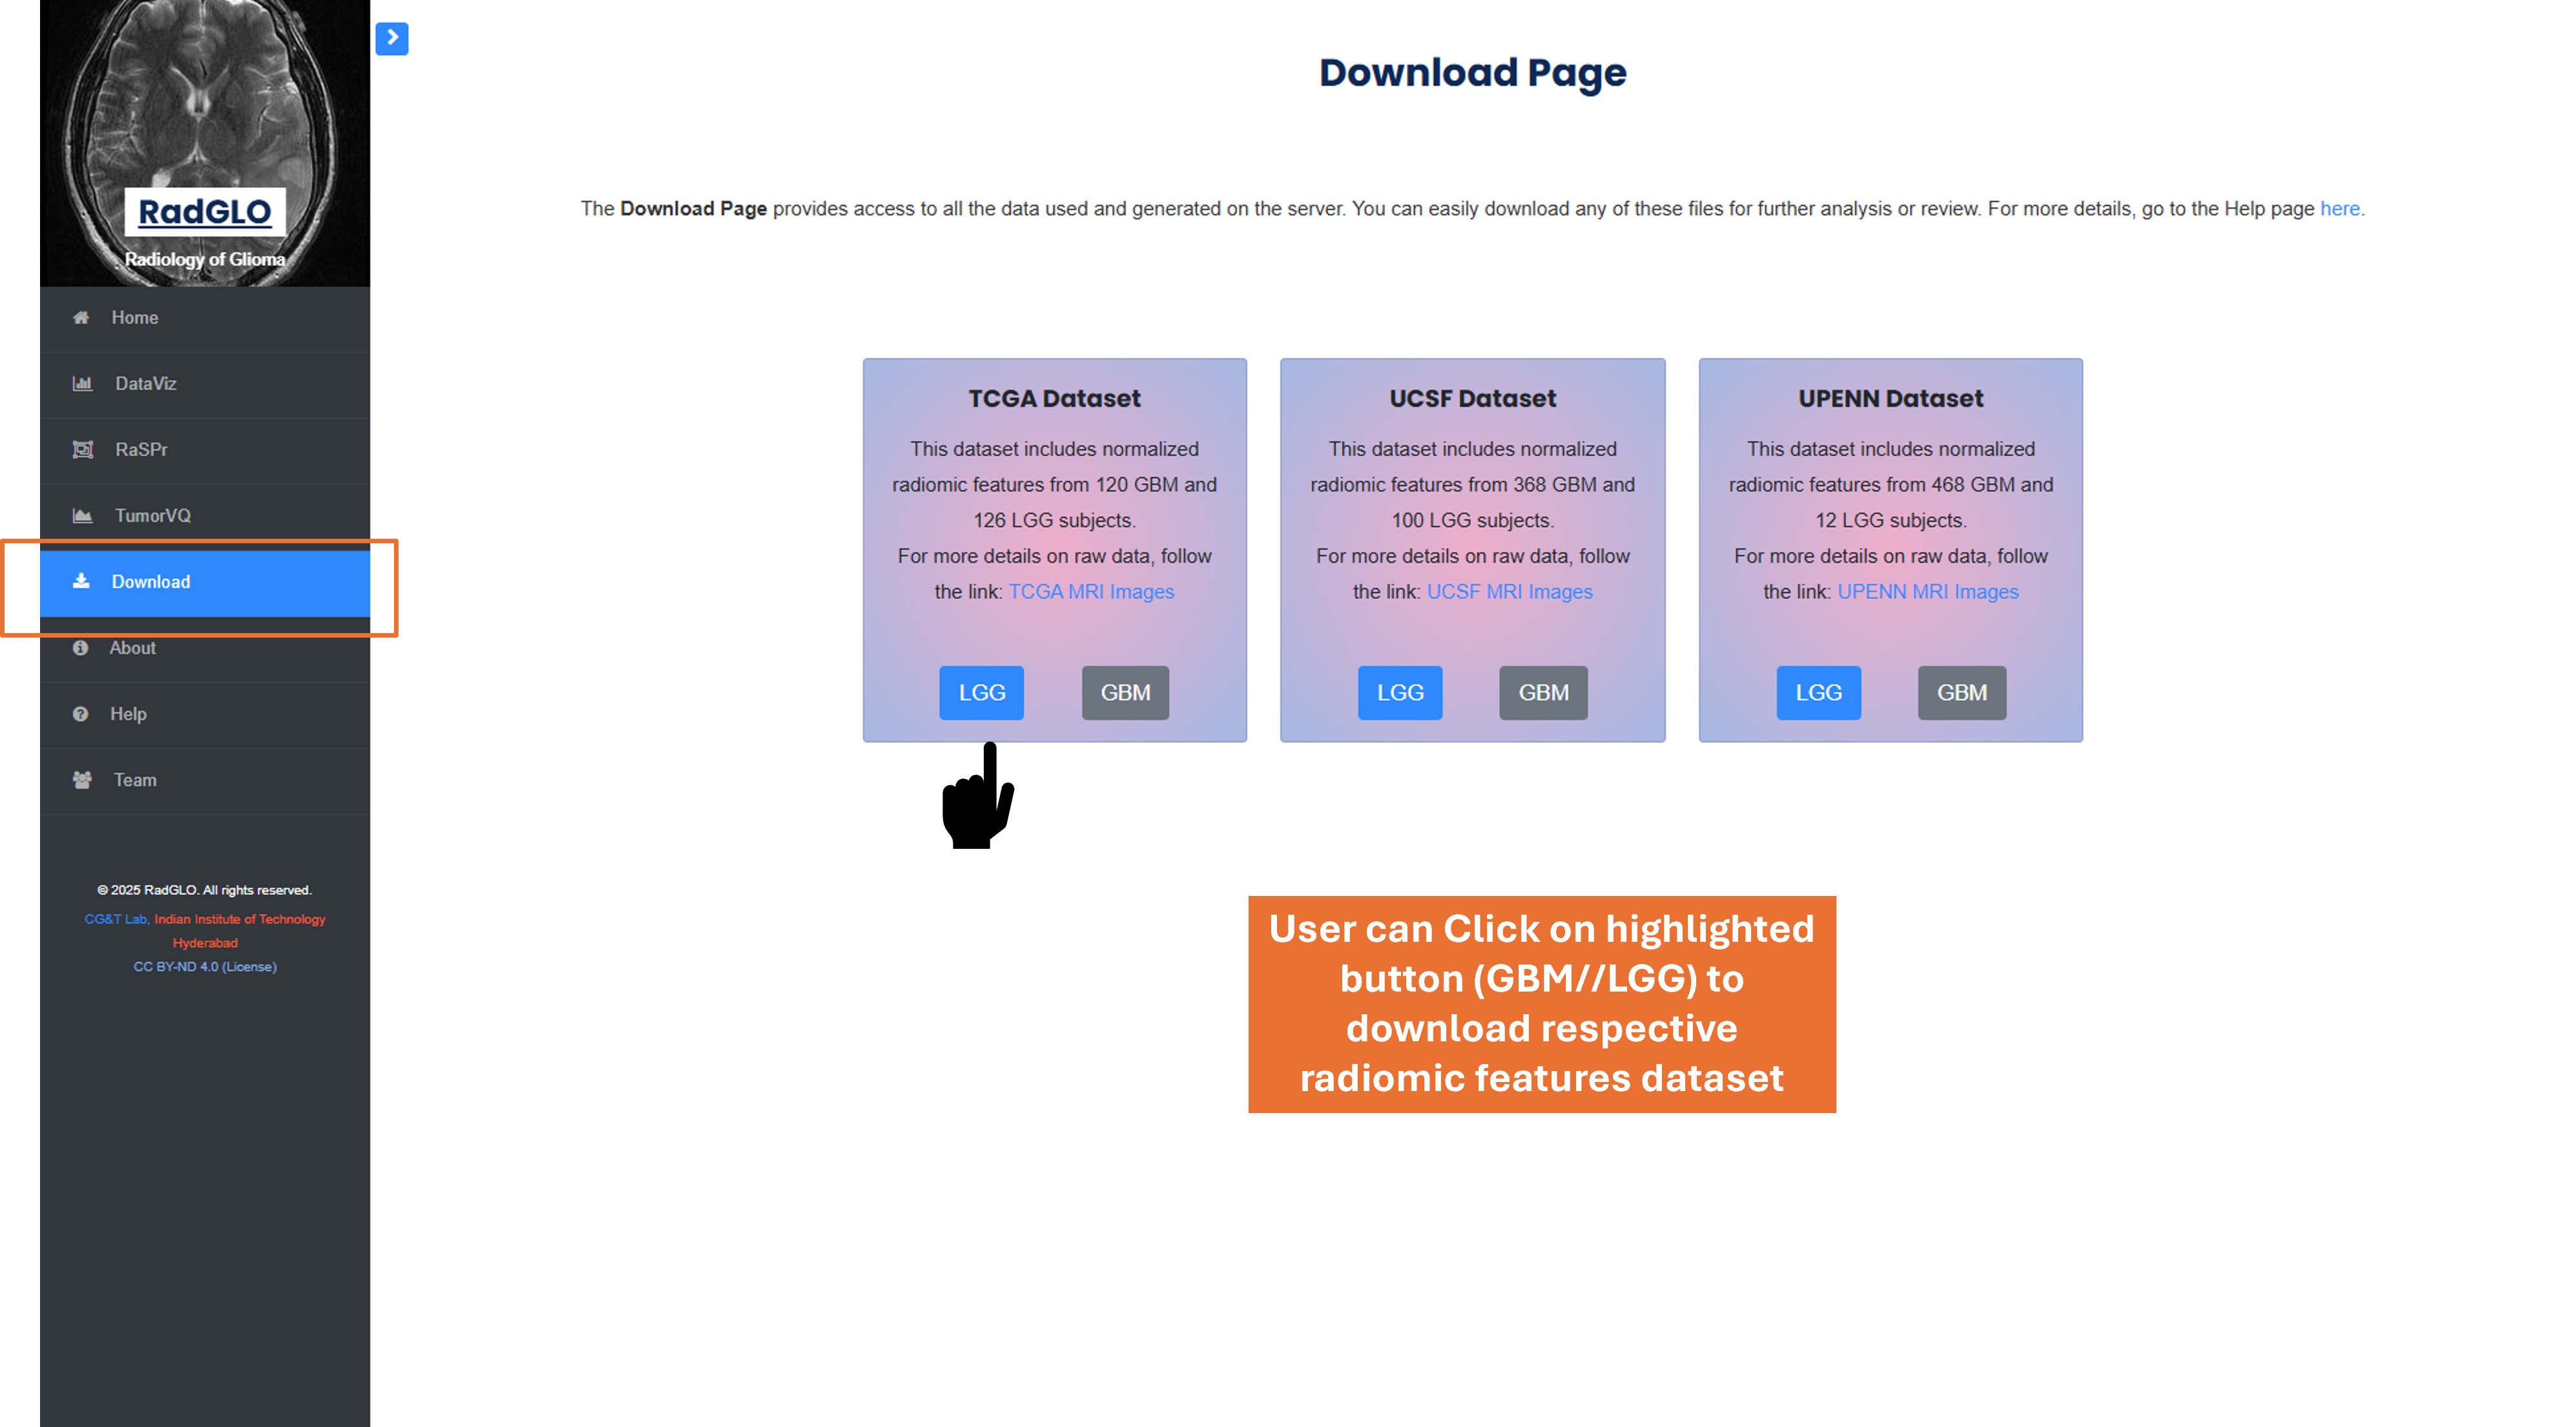
5. Download
Download page: Users can download radiomic features for a specific tumor grade and dataset.
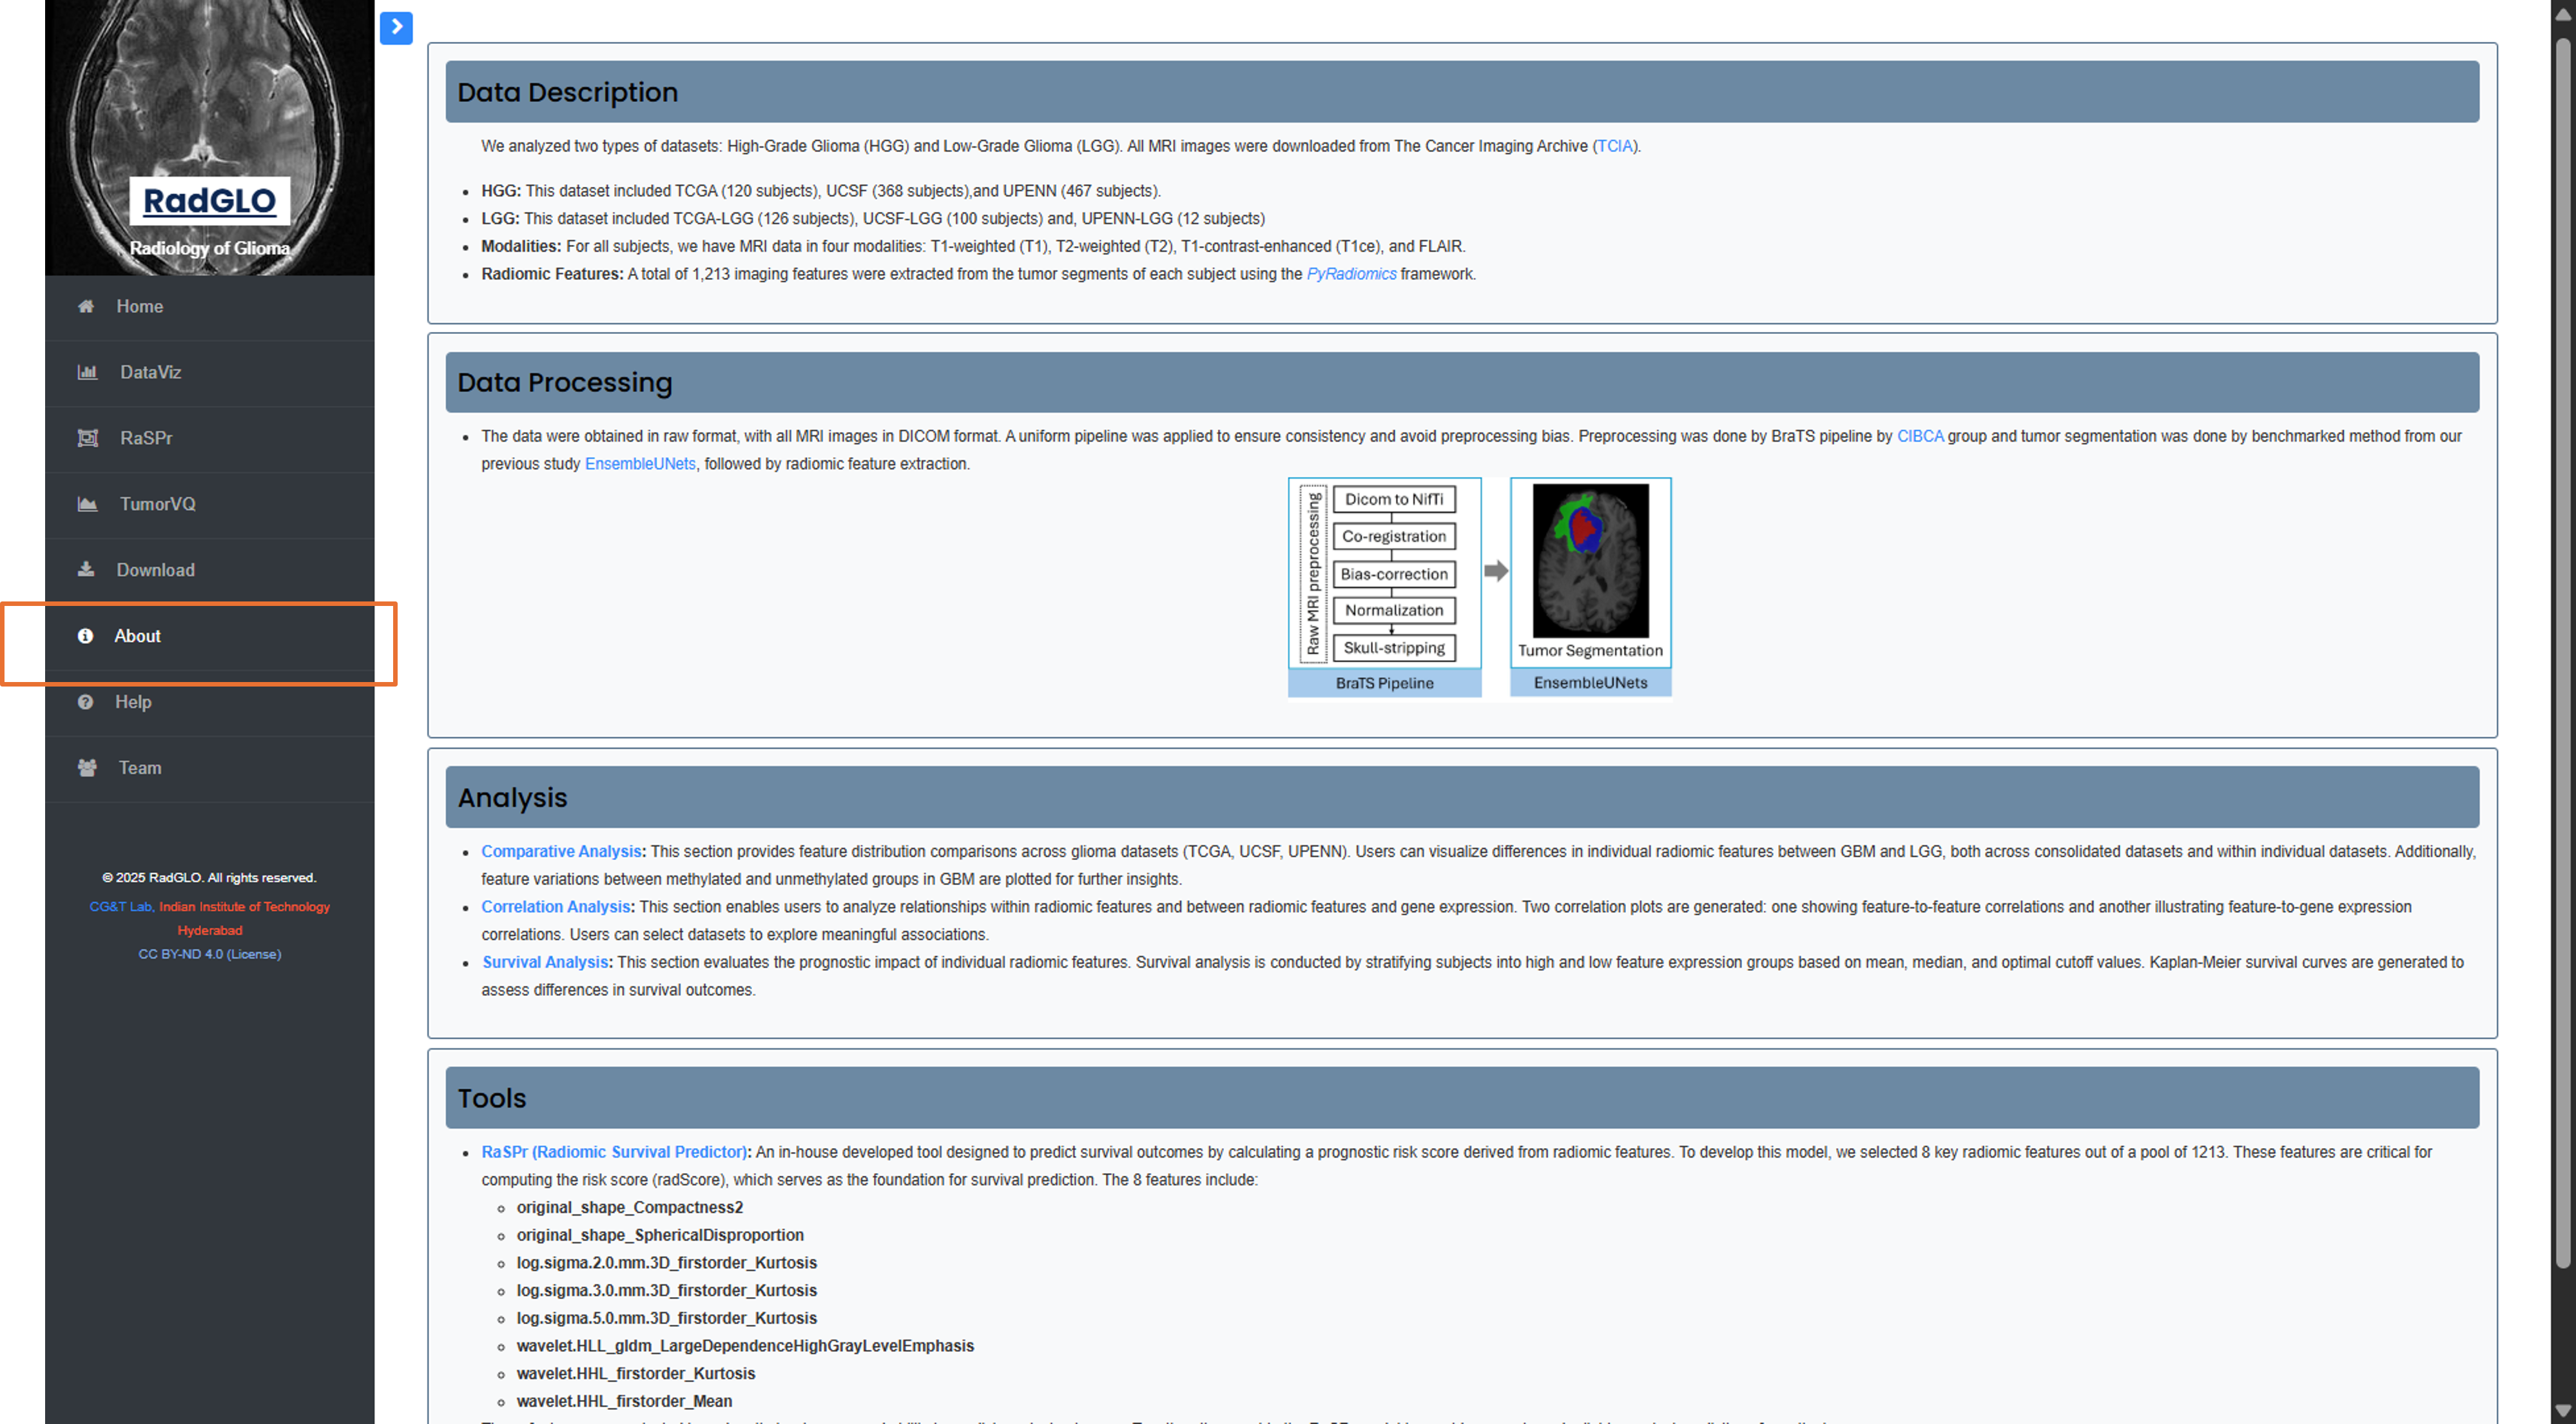
6. About
About page: Provides detailed information about the RadGLO platform, its modules, and purpose.
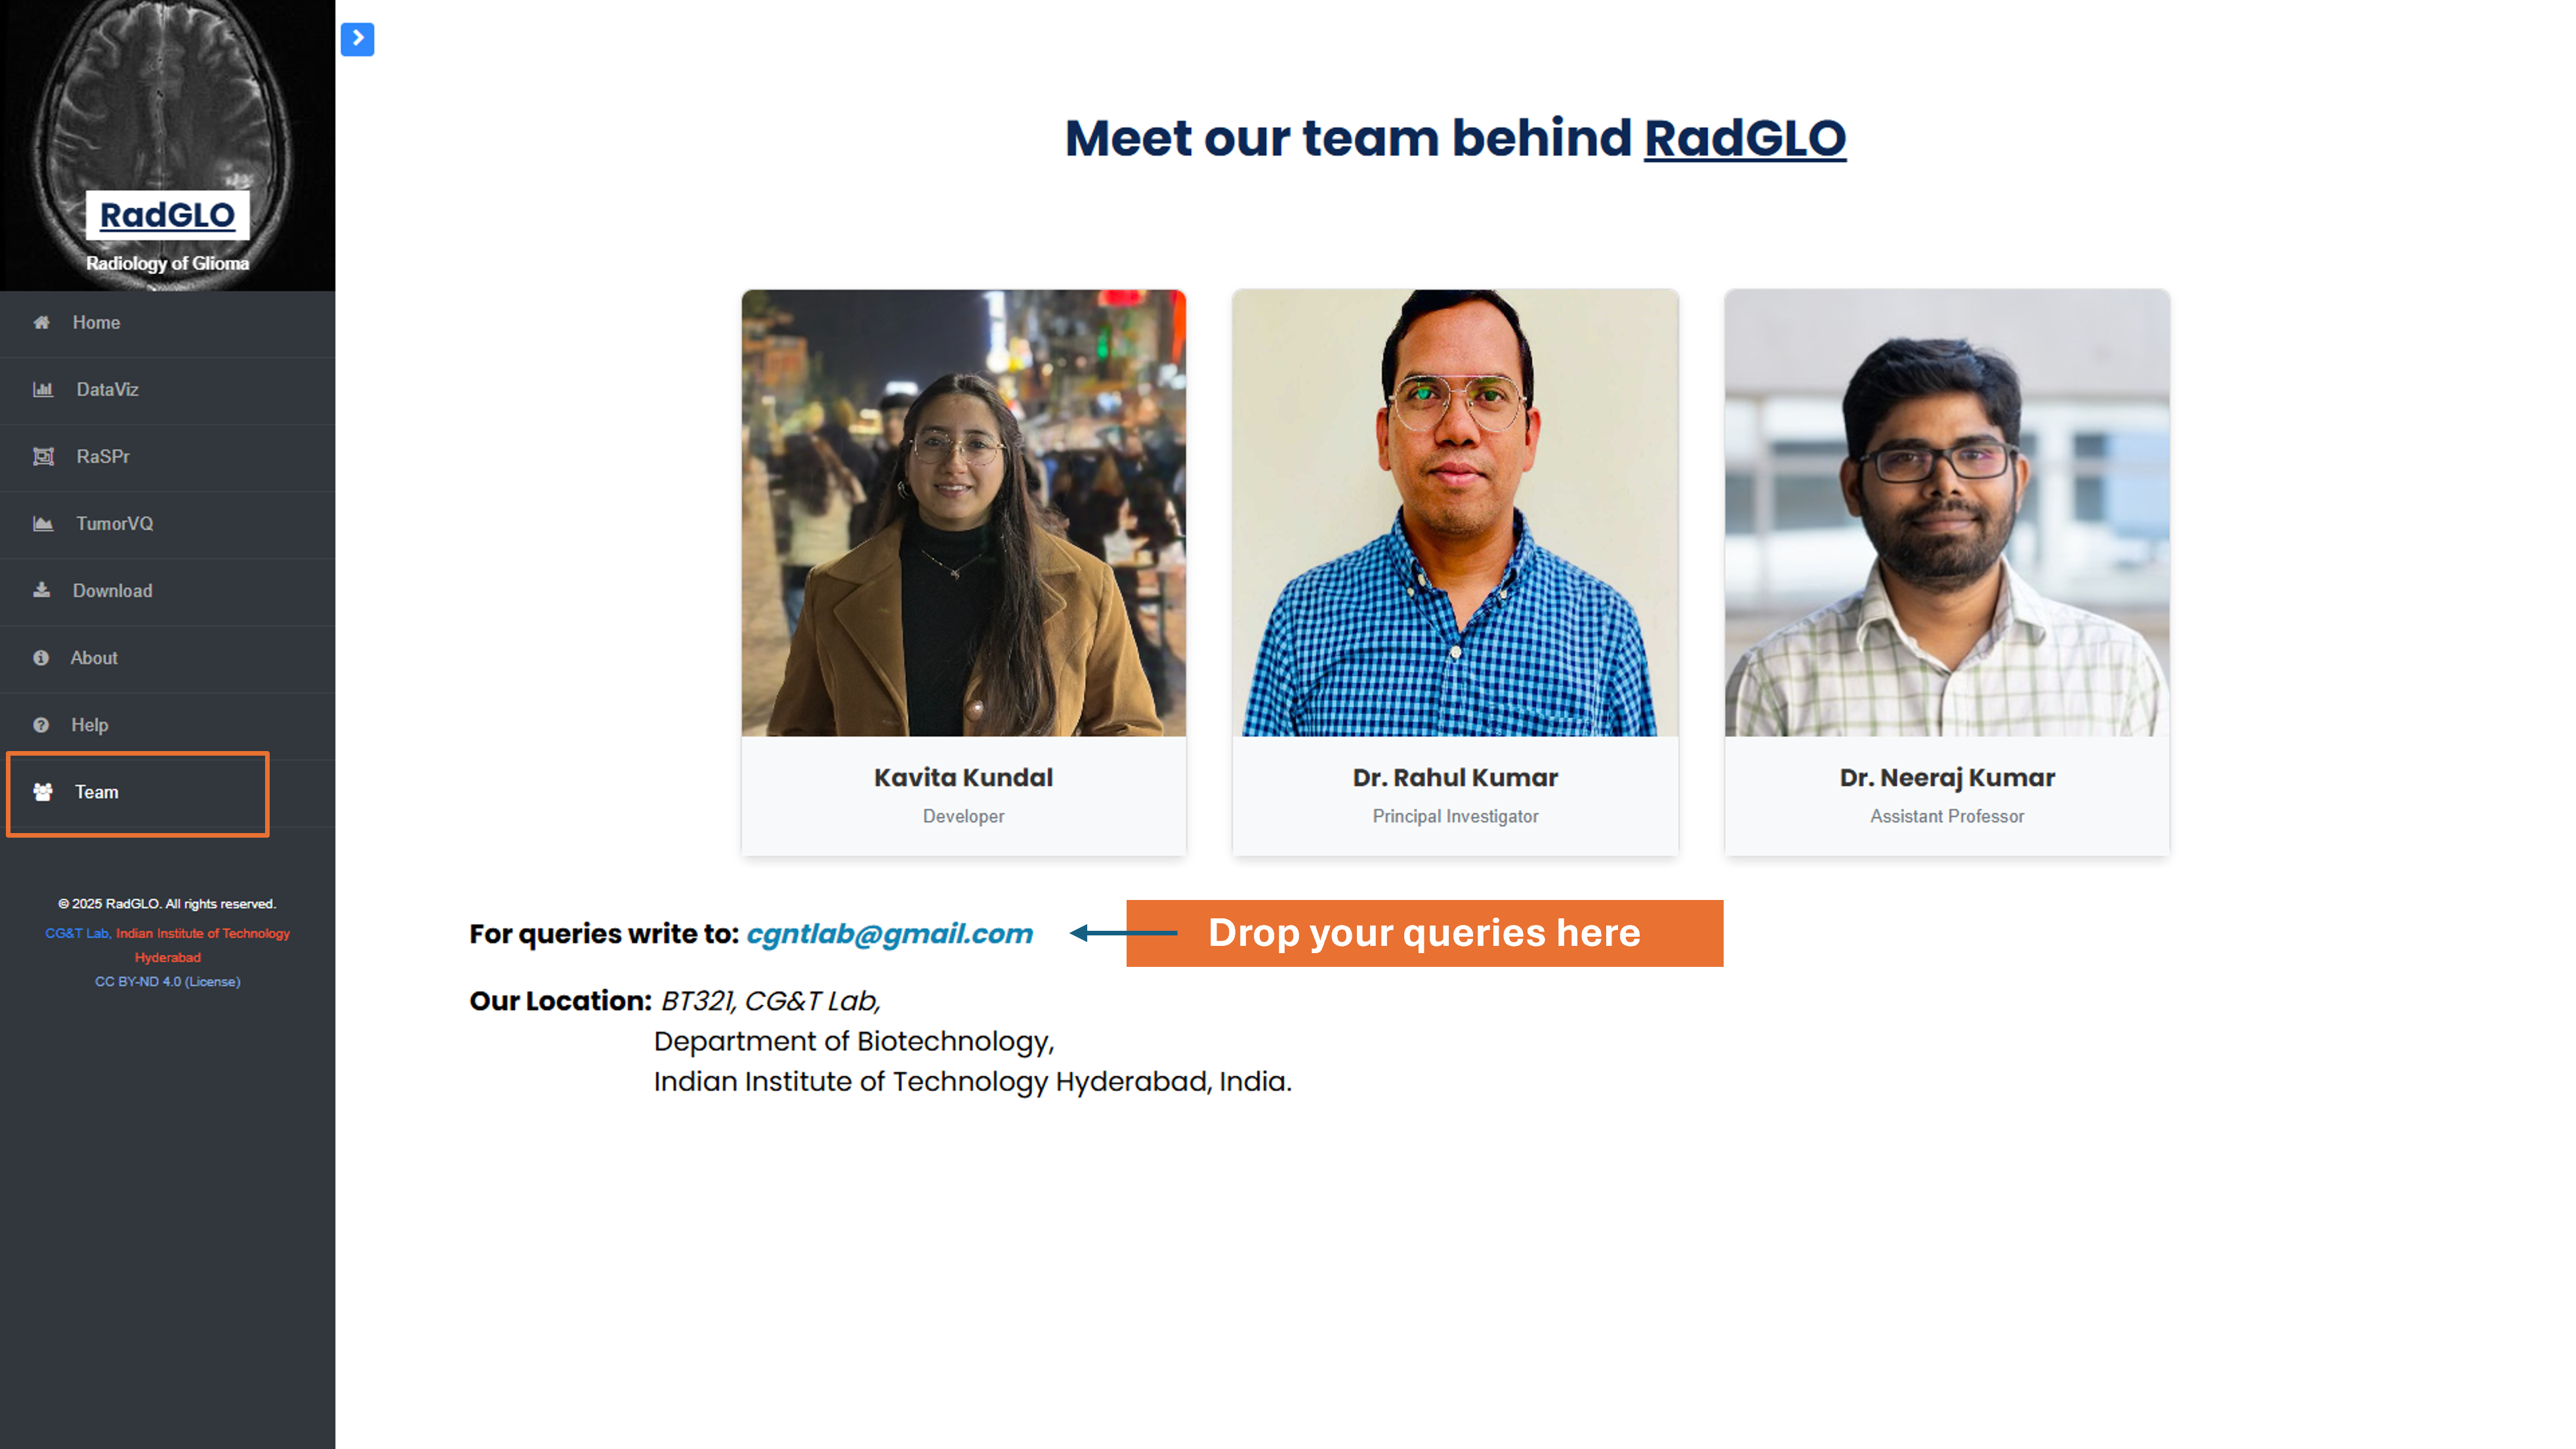
7. Team Page
Team page: Showcases the development team behind the RadGLO platform.