Data Description
- HGG: This dataset included TCGA (120 subjects), UCSF (368 subjects),and UPENN (467 subjects).
- LGG: This dataset included TCGA-LGG (126 subjects), UCSF-LGG (100 subjects) and, UPENN-LGG (12 subjects)
- Modalities: For all subjects, we have MRI data in four modalities: T1-weighted (T1), T2-weighted (T2), T1-contrast-enhanced (T1ce), and FLAIR.
- Radiomic Features: A total of 1,213 imaging features were extracted from the tumor segments of each subject using the PyRadiomics framework.
We analyzed two types of datasets: High-Grade Glioma (HGG) and Low-Grade Glioma (LGG). All MRI images were downloaded from The Cancer Imaging Archive (TCIA).
Data Processing
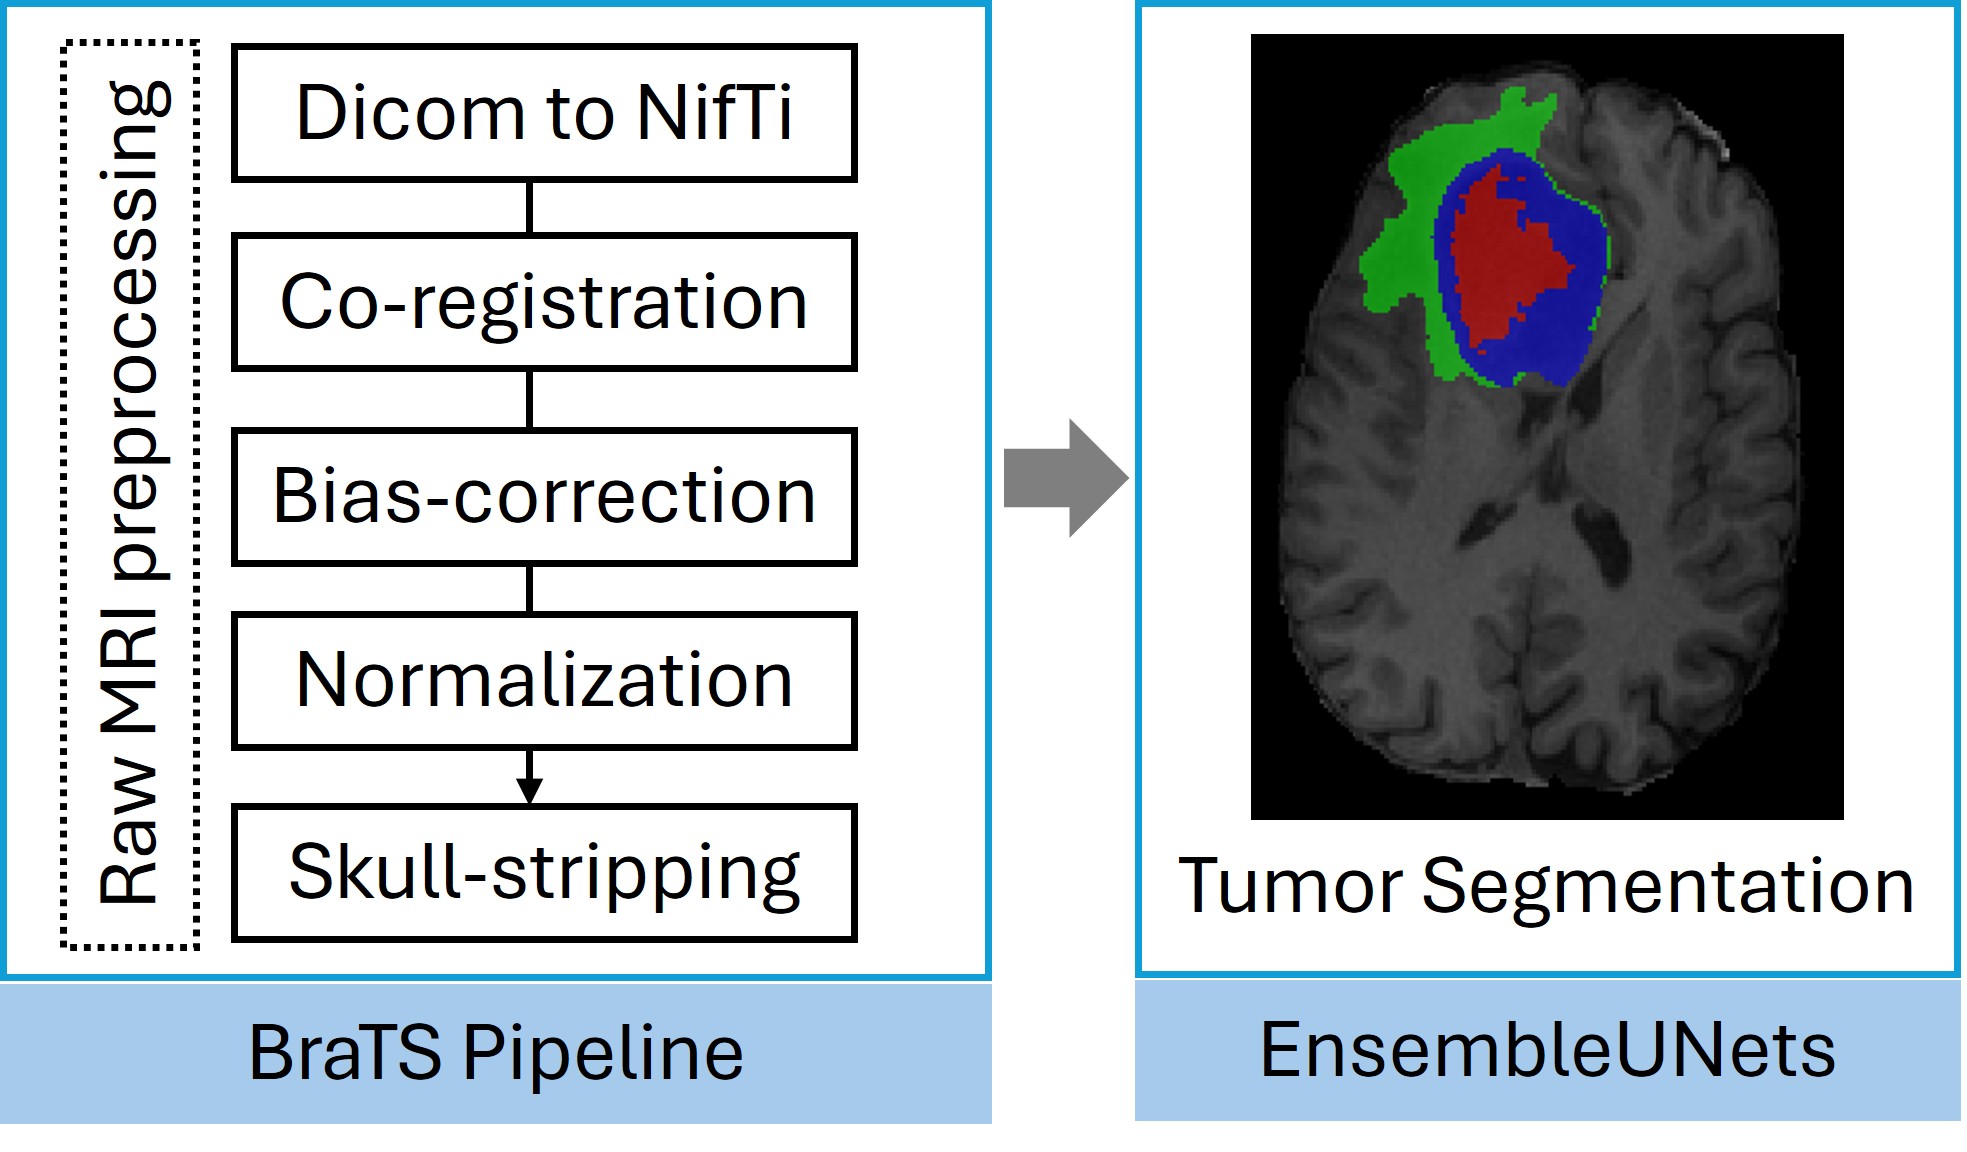
- The data were obtained in raw format, with all MRI images in DICOM format. A uniform pipeline was applied to ensure consistency and avoid preprocessing bias. Preprocessing was done by BraTS pipeline by CIBCA group and tumor segmentation was done by benchmarked method from our previous study EnsembleUNets, followed by radiomic feature extraction.
Analysis
- Comparative Analysis: This section provides feature distribution comparisons across glioma datasets (TCGA, UCSF, UPENN). Users can visualize differences in individual radiomic features between GBM and LGG, both across consolidated datasets and within individual datasets. Additionally, feature variations between methylated and unmethylated groups in GBM are plotted for further insights.
- Correlation Analysis: This section enables users to analyze relationships within radiomic features and between radiomic features and gene expression. Two correlation plots are generated: one showing feature-to-feature correlations and another illustrating feature-to-gene expression correlations. Users can select datasets to explore meaningful associations.
- Survival Analysis: This section evaluates the prognostic impact of individual radiomic features. Survival analysis is conducted by stratifying subjects into high and low feature expression groups based on mean, median, and optimal cutoff values. Kaplan-Meier survival curves are generated to assess differences in survival outcomes.
Tools
- RaSPr (Radiomic Survival Predictor):
An in-house developed tool designed to predict survival outcomes by calculating a prognostic risk score derived from radiomic features.
To develop this model, we selected 8 key radiomic features out of a pool of 1213. These features are critical for computing the risk score (radScore), which serves as the foundation for survival prediction. The 8 features include:
These features were selected based on their relevance and ability to predict survival outcomes. Together, they enable the RaSPr model to provide accurate and reliable survival predictions for patients.
- original_shape_Compactness2
- original_shape_SphericalDisproportion
- log.sigma.2.0.mm.3D_firstorder_Kurtosis
- log.sigma.3.0.mm.3D_firstorder_Kurtosis
- log.sigma.5.0.mm.3D_firstorder_Kurtosis
- wavelet.HLL_gldm_LargeDependenceHighGrayLevelEmphasis
- wavelet.HHL_firstorder_Kurtosis
- wavelet.HHL_firstorder_Mean
- TumorVQ (Tumor Volume Quantifier): A specialized tool designed to accurately determine tumor location and quantify tumor volume within specific brain regions.